Gold Miners Are Saying It’s Time

Back in early July I published the view that we needed Just a Little Bit More downside to complete the gold Investor Cycle.  All of the indicators and tools we used to spot these turns were firmly in place and it had become a matter of cleaning out the remaining bulls before turning.   At the time of publishing, gold stood at $1,130, and my expectation was for one more decline, below $1,110, in order to complete the Cycle and form a major Investor Cycle Low.

Well, that expectation has been fulfilled, and with the strength seen in the miners these past few days, we can say with a very high degree of confidence that the Gold Weekly (Investor) Cycle has turned.  Judging by the gold chart alone, that call might seem a touch premature.  But it’s the gold miners that almost always lead the gold Cycle out of significant troughs.   And whenever we see this much front-running strength within the miners, around these expected Gold Cycle Low timing bands, then it pays to be a little aggressive and expect that gold will quickly follow suit.


8-12 GDX Daily


A word of caution though, the miners are short-term overbought.  Anyone buying in here should be aware that a fast 1 to 2 day drop, back below the 10dma, is actually quite possible and within character.  Looking longer term, throughout this powerful bear market, we see these massive counter-trend rallies form in the precious metals miners. From the chart below, we see the miners respond to Gold’s Investor Cycle Lows and they rally clearly and quickly back towards the mean, often well before the next Gold Cycle top occurs. The typical Cycle, over 4 to 8 weeks, will see GDX rally 30% to 40% off the very bottom, giving you an indication of the potential still ahead.


GDX Weekly


To be clear however, this is not a call on the great gold Bear Market, it’s grip on this asset remains firm…for now.  What we can expect however is for gold to rally for 4 to 6 weeks and to the point where most bear market counter-trend rallies have stalled.  It’s at that point where we will see gold’s true, longer term intentions.


The Financial Tap publishes two member reports per week, a weekly premium report and a midweek market update report. The reports cover the movements and trading opportunities of the Gold, S&P, Oil, $USD, US Bond’s, and Natural Gas Cycles. Along with these reports, members enjoy access to two different portfolios and trade alerts. Both portfolios trade on varying time-frames (from days, weeks, to months), there is a portfolio to suit all member preferences.

You’re just 1 minute away from profitable trades! please visit: https://thefinancialtap.com


Just a Little Bit More

Back in May, I sent followers of this public blog a Gold Cycle Update, outlining how gold had a 75% chance of failing to rally, resulting in an unexpected downturn.  And then 3 weeks later, I sent a follow up article (Approach An Endpoint), where I outlined how gold was heading for a major Investor Cycle failure below $1,136.  As was predicted, the Gold sector was hammered this past week, with new lows being achieved in every nook and cranny of the precious metals complex. Silver and platinum crossed that threshold weeks ago, but for the Miners and for Gold itself, Friday’s high volume decline pushed them to new, multi-year lows. The Miners are especially concerning. Gold’s decline has been tame by normal standards, but the Miners are back at the depths of the 2008 plunge, having completely erased the gains of the last Cyclical bull market.

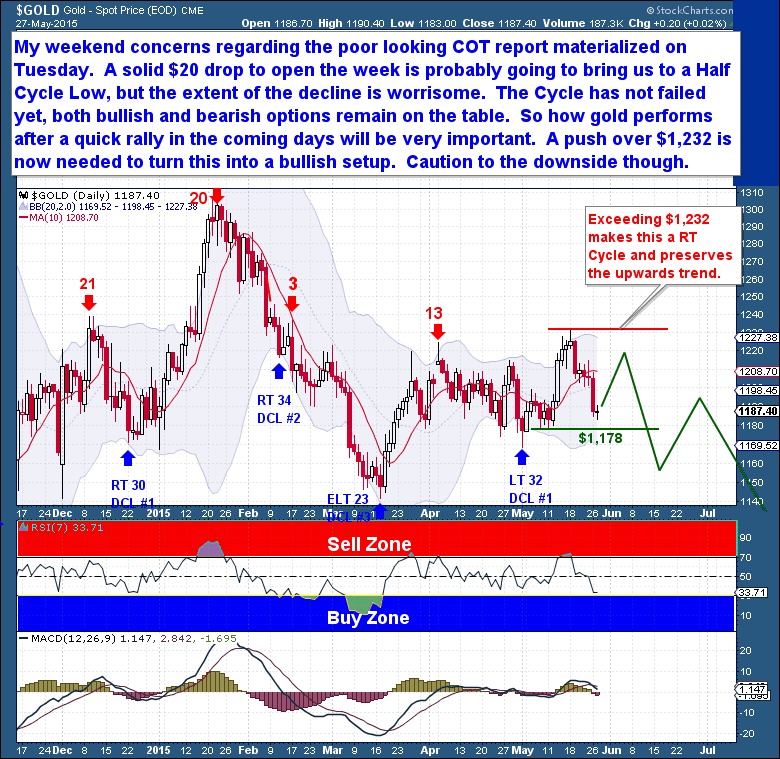
When looking at Gold’s decline in a Cycle framework, the action to this point has been fairly typical. The entire sector has moved exactly as we would expect when propelled by a failed Cycle in a bear market. To this point, Gold’s moves have followed the expectations I outlined many weeks ago.  Of particular importance is that, after a 2nd straight Daily Cycle failure, Gold is showing a clear breach of the prior Investor Cycle Low as well! This is (obviously) bear market confirmation, and opens the possibility of massive capitulation in the coming days and weeks. The relatively predictable portion of the Cycle is over, and we’re moving into the area where there are more possibilities.

We’ve seen just 3 Daily Cycles in the current IC, and ICs generally have 4 DCs. Although the length of the current IC (week 17) supports an ICL at this point, it is early enough to easily accommodate another Daily Cycle (5 weeks) before the ICL. Both scenarios are possible, so we’ll need to let secondary evidence unfold. The best hope for bulls is to see a massive capitulation event this week. If that happens it should mark an ICL.  (Note: A Daily Cycle (DC) is measured in trading Days. Investor Cycle (IC) measured in weeks.  (See Glossary of Cycle terms)

7-17 Gold Daily

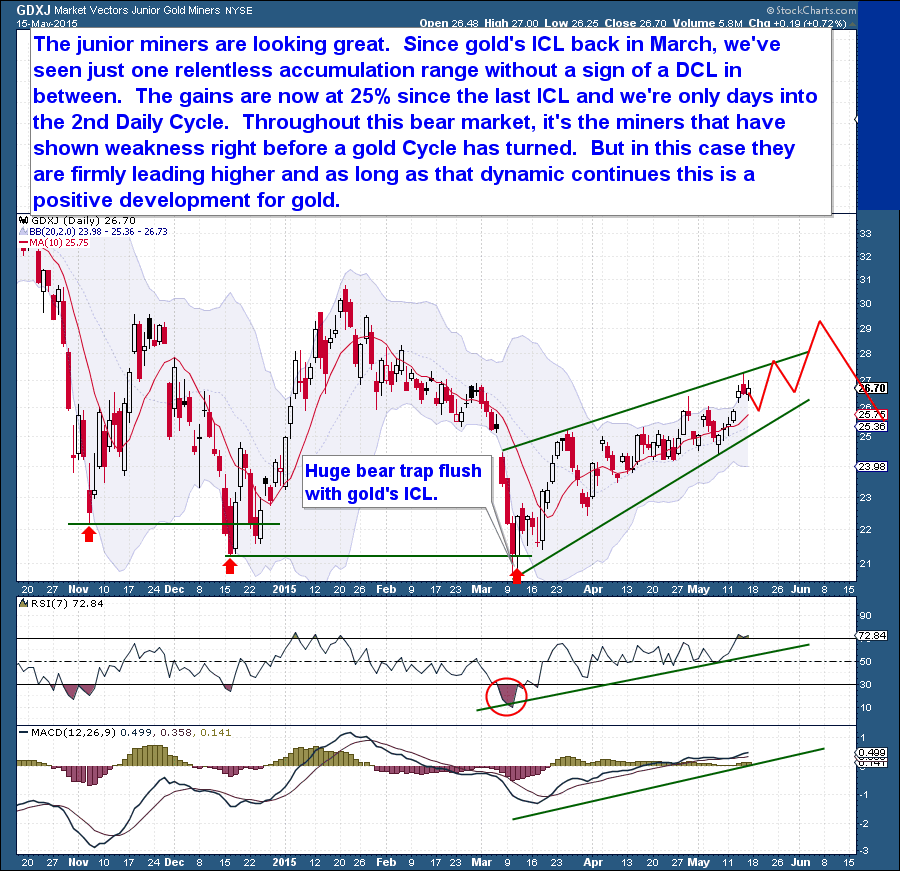
The Miners are showing complete confirmation of Gold’s decline. They’re down 8 of the last 9 weeks, are showing a massive weekly Bollinger Band crash, and are at an RSI level not seen in years. This is end-of-Cycle action, the type of behavior seen only in a big Gold ICL event. Of course, the Miners are known to free-fall during ICL declines, so it can always get worse. But with the decline already at 27%, an ICL could be imminent.

7-17 GDX Weekly

Another indicator I’ve found useful in identifying ICL’s is the Miners bullish percent chart ($BPGDM). The number of Mining stocks showing bullish P&F charts have hit bottom again, a clear sign that selling pressure is at a crescendo and that a Gold ICL is coming. This indicator is never a perfect timing tool, but history shows that whenever the Gold mining stocks have hit the current BPGDM level, a Gold ICL typically arrived within 1-2 weeks.

7-17 Gold miners PF charts

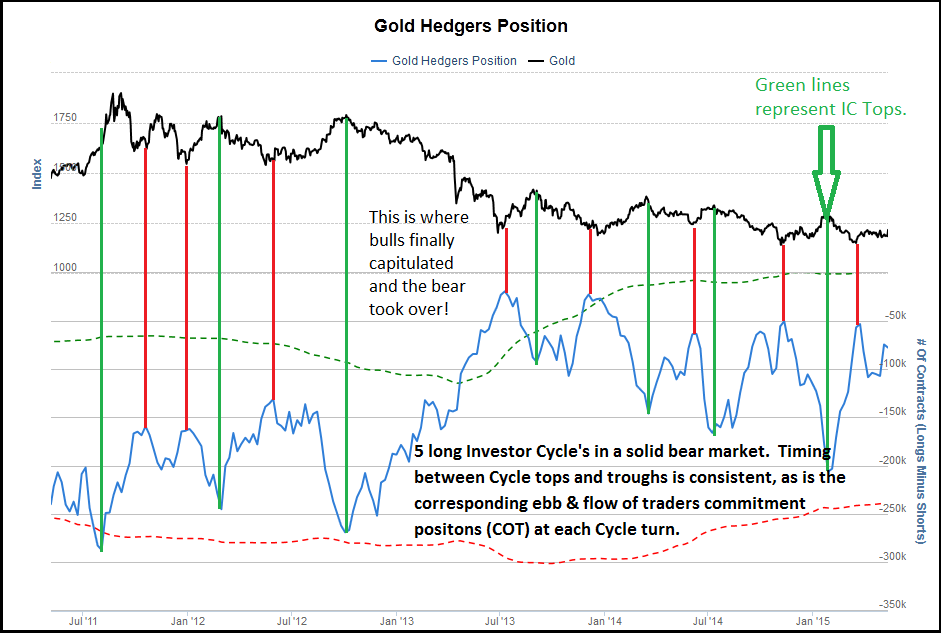
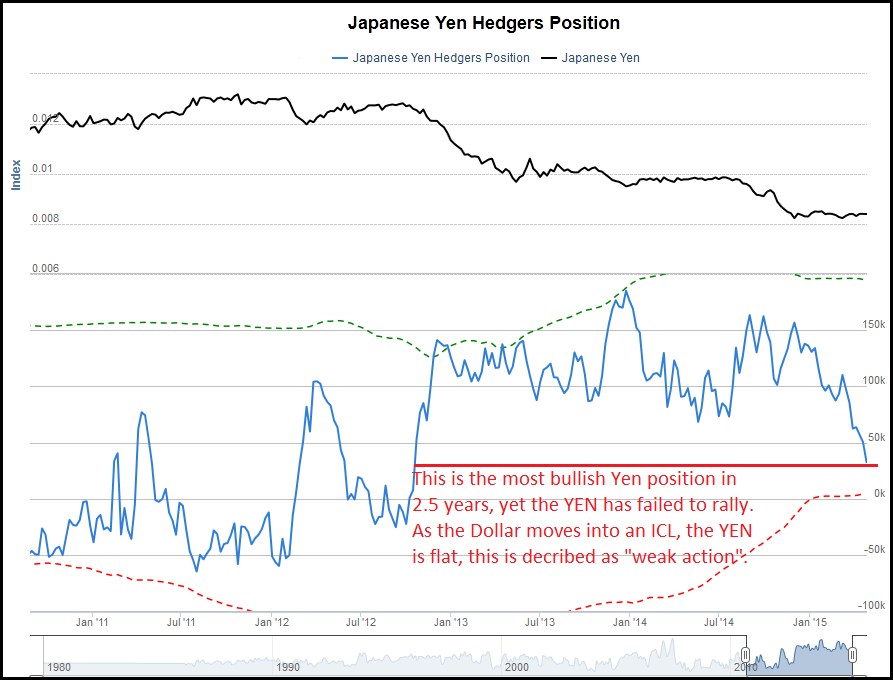
Long time followers know how much I value the COT reports. They show how speculators are positioned in an asset, and extreme positions are typically associated with Cycle tops and troughs. A Cycle represents the collective ebb and flow of an asset, and mapping cycles versus speculator positioning creates a very useful predictive tool.

The current COT report shows that Gold is ready to form an Investor Cycle Low. Even considering that the below chart doesn’t include the declines of the past 3 days, it shows that speculators are positioned more aggressively against Gold than at the 3 most recent ICL’s. This is a telling contrarian indicator. Although the COT report is not the best timing tool, there is likely not enough room in these numbers to support another Daily Cycle.

7-18 Gold COT

Another favorite indicator is the sentiment chart. The ebb and flows of sentiment have a very high correlation with the tops and troughs of the Cycles. With little fanfare, and in true apathetic bear market style, Gold sentiment dropped this week to the 2nd lowest level ever recorded. Again, the below chart doesn’t include the drop into the weekend, but it clearly shows that the next Daily Cycle Low could mark a major turn for Gold.

7-17 Gold Sentiment

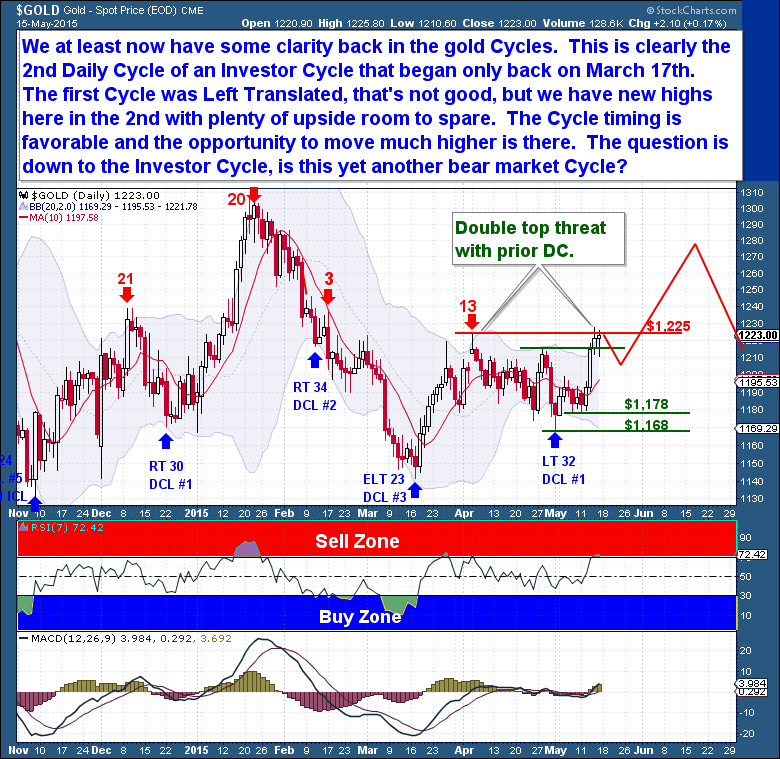
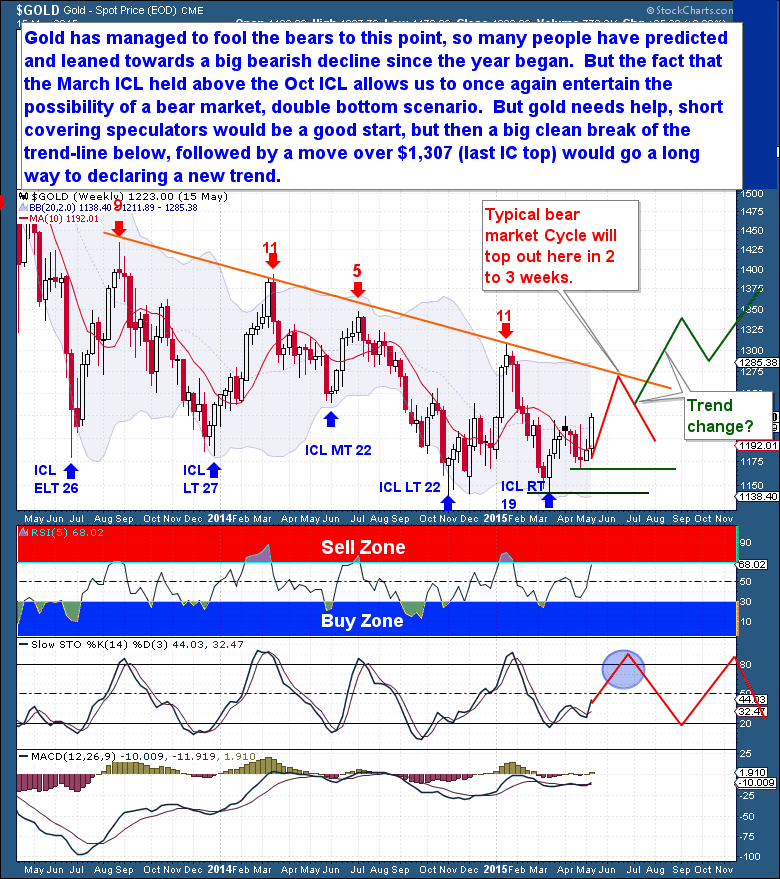
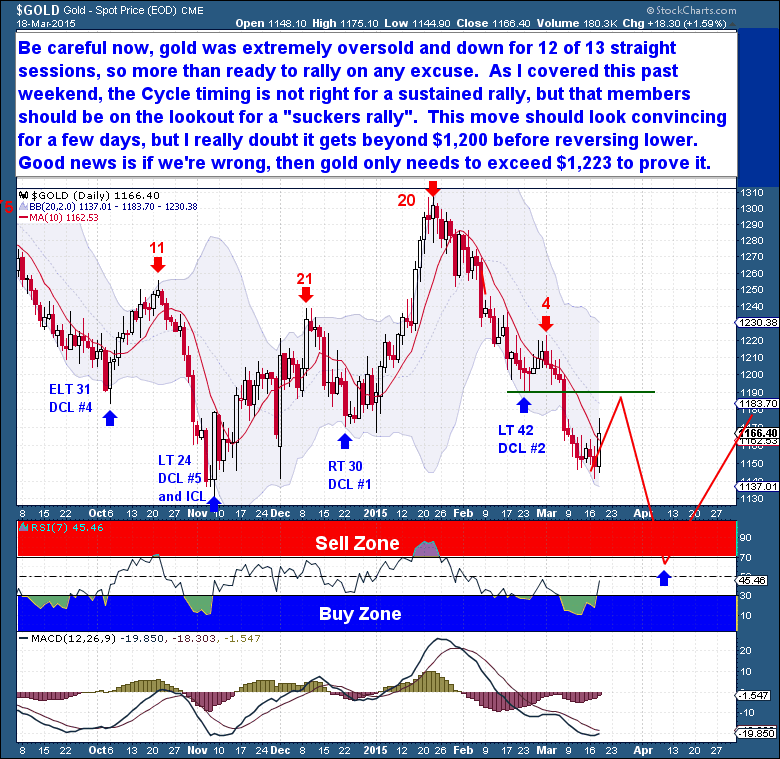
This brings us to Gold’s most important chart – the weekly chart. For months, I’ve been watching for an IC containing 4 DCs to play out, primarily because most IC’s are structured with 4 DCs. The below chart how closely Gold has mirrored past Cycle moves.

With all of the secondary evidence supporting an ICL in the very near future, I’m no longer convinced that we have another DC ahead. But I’m also hesitant to call the current decline an ICL because of the weekly timing. We have to keep in mind that during bear markets, it can always get worse – much worse. It’s the falling knife trap, where an extreme drop encourages traders to call a bottom prematurely. And that can be dangerous.

But I cannot ignore the evidence presented earlier. A Cycle on Week 17 may be a little early, but it’s well within an acceptable time-frame for an ICL. And if Gold continues to capitulate to start the week – possibly falling another $100 in very fast action – I believe that Gold would likely see a week 18 ICL at the end of the week.  If I were pressed to say which outlook I favor…I’d declare that I believe that Gold is just days from an ICL.


7-17 Gold weekly

But whether or not an ICL is imminent does not help us in determining Gold’s longer term possibilities. Longtime premium members will know that I generally refrain from longer term predictions (most analysts make them exclusively for marketing/promotional purposes). Longer term predictions generally carry only a 50/50 probability, and can have the nasty side-effect of clouding shorter term trading with expectations of long term price movements.

The only long term factual statement I can make about Gold is that the Investor Cycles are showing a failed series in decline. That’s the definition of a bear market, and shows that Gold wants to continue moving lower. It would feel great to pick the upcoming ICL as the bear market low, but the reality is that our primary expectation must be that the next Investor Cycle is another failed, declining Cycle.

At some point that pattern will reverse, but it will be when the bear market is ready to end, and not before. We can’t (and shouldn’t) attempt to make that call in advance – evidence of a new bull market must emerge prior to any call that the bear market is over. If your ego can allow you to do that, you will be better prepared to accept the highest probability event – another declining Investor Cycle.


The Financial Tap publishes two member reports per week, a weekly premium report and a midweek market update report. The reports cover the movements and trading opportunities of the Gold, S&P, Oil, $USD, US Bond’s, and Natural Gas Cycles. Along with these reports, members enjoy access to two different portfolios and trade alerts. Both portfolios trade on varying time-frames (from days, weeks, to months), there is a portfolio to suit all member preferences.

You’re just 1 minute away from profitable trades! please visit: https://thefinancialtap.com


Crude Oil Nearing Exhaustion

For an asset like Crude, which is normally extremely volatile, the current prolonged sideways range is very much out of character. Crude has us accustomed to daily swings of 2% to 3%, and to shorter term rallies/declines that draw in traders before reversing suddenly. Crude is generally an asset that fluctuates in price, so the current “flat-line” action is rare.  Since the last Daily Cycle peaked on May 6th, Crude oil has been locked in a sideways trading range. Short term traders, expecting the usual crude oil volatility, are being chopped to pieces.

As a result, Crude’s Bollinger Bands are now the tightest they’ve been in over 2 years. And, as with every asset I track, tight Bollinger Bands are almost always a precursor to a significant move. I’m confident that Crude’s next move will be extremely sudden, and is likely to extend far outside the Bollinger Bands before coming to an end. The only question is the direction. I believe that it will be higher, but this view is pure speculation. And the longer the move takes to develop, the more likely it is to, instead, be a bearish move down.  From a position standpoint, traders should focus on a sizable move and volatility, as opposed to being fixated on any one direction.

Within my premium member reports, I have been warning for months that the rally off the March lows is counter-trend in nature.  I continue to believe that Crude oil has entered into a bear market period and that once this reactionary move is exhausted, crude will continue its new primary trend lower.  That said, I believe that counter-trend move has some life left, so I am siding with the view that Crude will see an upside breakout before finally reaching exhaustion.


6-26 Crude Daily


The Financial Tap publishes two member reports per week, a weekly premium report and a midweek market update report. The reports cover the movements and trading opportunities of the Gold, S&P, Oil, $USD, US Bond’s, and Natural Gas Cycles. Along with these reports, members enjoy access to two different portfolios and trade alerts. Both portfolios trade on varying time-frames (from days, weeks, to months), there is a portfolio to suit all member preferences.

You’re just 1 minute away from profitable trades! please visit: https://thefinancialtap.com

Approaching An Endpoint

Apart from two mini-peaks at recent Daily Cycle (DC) tops, Gold’s current Investor Cycle has traded in a narrow, horizontal range.   The Investor Cycle (IC) began with 10 good trading days back in March, but has since moved sideways. If the bulls were back in control of the gold market, they would driven Gold to make much more significant gains during the early favorable IC periods (first 8 weeks). Despite being in the most favorable (early) part of the Investor Cycle, Gold failed to catch the bid necessary to move it higher, and has now entered the IC’s normal period of decline.  (Note: A Daily Cycle is measured in trading Days. Investor Cycle measured in weeks.  See Glossary of Cycle terms)

During the past 4 years, each Investor Cycle within this bear market decline was already well into decline by week 13 – where the current IC rests. On the daily chart, Gold is sporting a new series of lower lows, and it’s likely it will soon have a series of lower highs as well. In short, the daily chart shows the arc (green line) of an Investor Cycle that has moved into decline.  After a $30 run that peaked at $1,191, Gold will start the week on day 6 of the current DC and has begun to turn lower. Although a top after only 3 days may seem aggressive, it’s important to remember that the last eight 3rd Daily Cycles did not make it past day 8.

A significant component of Cycle study focuses on identifying the type of Cycle an asset is following, and correlating that Cycle type’s typical performance to the asset. When a strong identification is possible, as with Gold today, the predictability of future performance is generally very high. So for the moment, we can only conclude that the bears remain in control, and that Gold is showing a setup only a bear could love. Based on these charts and longer term Cycle counts, we should prepare for a new down-leg. If another rally were to materialize this week, I’d expect it to be modest and to fizzle very quickly.

6-14 gold daily

Shifting to the precious metals Miners, a look at recent performance shows that they have actually held up relatively well.   But they, too, are no longer rising and have begun to languish. And history shows that the Miners don’t perform well when they trade in a low volatility, slow motion decline as at present. Very often, when a Gold Cycle ages, the Miners are the first asset to give way in a waterfall decline into an Investor Cycle Low (ICL).

In addition, the percentage of mining stocks showing bullish P&F charts (the BPGDM index) is declining, and this typically means that the Gold Investor Cycle is in decline too. That makes sense, as Gold is showing a failed Daily Cycle. Even though the BPGDM at current levels has, in the past, been accompanied by a Gold ICL, Gold’s current weekly IC count is far too early (Week 13 of 20-24 week Cycle) to expect that we are seeing an ICL. So the Gold Cycle and precious metal Miners are likely to see more downside in the coming weeks.

6-13 Gold miners P-F charts

Amidst all of the negative signs for Gold, it’s worth mentioning one bright spot – the sudden and powerful change in the COT reports. Again, it’s far too early for an ICL, but the COT report reflects that Gold has moved lower and is not all that far away from ICL levels. Though it’s not my primary expectation, this could be a harbinger of a short Investor Cycle, one that could end when the current Daily Cycle finds a Daily Cycle Low (DCL) over the next 3 to 5 weeks. The primary point is that Gold is well into the declining portion of its Investor Cycle.

6-13 Gold COT

Courtesy Sentimentrader.com

Earlier, we discussed Gold’s current sideways price action. The weekly chart (below) highlights the anemic nature of Gold’s rise during the current IC, which is largely attributable to poor 1st and 2nd Daily Cycles. Gold didn’t see the significant rise early in the IC that it normally does. In this case, I would have expected Gold to approach the large, declining trend-line, but that didn’t happen. Gold now appears ready to resume its long term downward trajectory.

The Daily Cycle failure last week encouraged me to conclude that current IC topped on week 9. With 4 years of similar Cycle action as a reference, it would be extremely unusual at this point to see Gold move anywhere near the week 9 high ($1,227). It’s impossible to rule out one more attempt to rally next week, but in general, pressure should come from above, and will likely attempt to force a Gold Investor Cycle failure (below $1,136).

The question today is not whether Gold can recover and surprise to the upside. Rather, it’s whether Gold can manage to hold the $1,130-40 area during the coming ICL. For 2 years, through the last 4 Investor Cycles, Gold has held above that level, so many believe that it will do so again. But the general rule in technical analysis is that repeated attempts to break a support line will eventually succeed. Just as, during the 2012-13 period, multiple attempts to break the $1,520 area period eventually succeeded and led to major capitulation, there is a real possibility that Gold could punch through support and cascade lower.


6-13 Gold Weekly


The Financial Tap publishes two member reports per week, a weekly premium report and a midweek market update report. The reports cover the movements and trading opportunities of the Gold, S&P, Oil, $USD, US Bond’s, and Natural Gas Cycles. Along with these reports, members enjoy access to two different portfolios and trade alerts. Both portfolios trade on varying time-frames (from days, weeks, to months), there is a portfolio to suit all member preferences.

You’re just 1 minute away from profitable trades! please visit: https://thefinancialtap.com

You Don’t Know Where the Market is Heading!

I’ve been of two minds recently regarding the current Cycle picture in equities. So this week I focused more attention on finding secondary evidence to support a more definitive position on direction. As I suspected it might, my research provided an almost endless array of contradictory evidence and facts.

The internet and social media are a mixed blessing to researchers – they can lead to a huge number of hypotheses and points of view, but the quality of information is generally pretty low. At its best, however, the internet can lead to ideas and links to compelling analysis and primary sources. The point is that there exists online a mass of data points, ideas, opinions, analyses and thesis that can occasionally help to bring real clarity of thought, but more often, the information serves only to confuse, and even obfuscate.   From a trader’s perspective, the information is generally unable to answer the questions that are of greatest import.

This lack of clarity is especially pointed today. We are faced with an equity environment where it is impossible to know what the next 3, 6 or 12 months will hold. The FED and other central banks are meddling in the market in unprecedented ways and at unprecedented levels, all while the market is at its most unpredictable. Equities are in the late stage of a cyclical move, significantly overvalued, but without the huge “blow off” that typically marks the end of a bull market. So the S&P could drop like a stone or rally for 300 points, and neither would be a surprise.

The upshot is that we don’t need, and should not attempt, to predict the next move. Instead, we need to understand and accept the different possibilities that emerge from the market’s position in its cycles. There is power, and peace, in understanding the different possibilities and being ready to take advantage of them.

On the daily chart, the whipsawing action has continued. It is demonstrated clearly by the alternating red and white candles (below), each of which signifies a single day, down or up. The market will remain trend-less until we see either a) a Cycle failure (price moving below 2,067) or b) a burst to a convincing new high. Until one of these happens, we won’t know if this remains an extended (declining) Investor Cycle, or the beginning of a massive breakout. There is no sense trying to front-run a major move in either direction. It’s better that we simply remain patient.

5-30 Equities Daily

The weekly chart is much more interesting than the daily because it shows that time appears to be running out for this sideways move. Price is being contained by a narrowing wedge, and I’d expect the S&P to begin its next significant move within 1-2 weeks. The first clue on direction will be how price breaks from the tightening wedge, whether it breaks up or down. Confirmation of the move will come via a failed Daily Cycle (< 2,067) on the downside, or a clean break and rally on the upside.

Either way, with Oct 2014 as the last Investor Cycle Low, equities are on Week 33 and (well past) due for an Investor Cycle Low. Therefore, any upside break and rally from this point must mark a new Investor Cycle, and would support the idea that the S&P has been in a sideways consolidation for the past 2 months. They occur rarely, but those are very powerful Cycle Lows, so an upside break, if it comes, should not be expected to top quickly. Alternatively, a breakdown from this point would be a continuation of the October Cycle, likely resulting in a fast 3-5 week collapse into a long and extended ICL.


5-30 Equities Weekly

Possible Trading Strategy

I am convinced that if the market breaks higher it will mark a new Investor Cycle.  A breakout would be a sign of a massive new move in a new Investor Cycle, and I would consider buying it with decent size.

Alternatively, a failed Daily Cycle (Below 2,067) would mean that the current Investor Cycle is on week 33 and just 3 to 6 weeks from an extended Investor Cycle Low. The downside will likely be capped, so I don’t expect the October Low to be threatened. There would, however, be plenty of downside potential to warrant taking a Short position.


The Financial Tap publishes two member reports per week, a weekly premium report and a midweek market update report. The reports cover the movements and trading opportunities of the Gold, S&P, Oil, $USD, US Bond’s, and Natural Gas Cycles. Along with these reports, members enjoy access to two different portfolios and trade alerts. Both portfolios trade on varying time-frames (from days, weeks, to months), there is a portfolio to suit all member preferences.

You’re just 1 minute away from profitable trades! please visit: https://thefinancialtap.com


Gold Cycle Update

Recently within the article More Breathing Room I had outlined how gold had at least 3 to 4 weeks of upside surprise left within the current weekly Cycle.  Unfortunately, gold failed to take advantage and has since shown signs of breaking down.  And within the recent weekend premium report, I outlined a rather significant shift in my gold Cycle outlook based almost exclusively on the bearish COT report.

Those concerns materialized almost immediately once the trading week began, as gold dropped a solid $20 straight out of the gate. The other concerns were a dollar showing signs of a major Cycle Low, while gold itself is now up to week 10 of the Cycle, near the point where bear market Cycles top, as every Cycle since 2011 has failed to exceed week 11 with new highs.

In the very near term, this decline seen in the chart below has become oversold. And because we’ve yet to see a Low that resembles the Half Cycle point, it’s likely that gold will reverse at this time and mount some type of bullish looking advance. But that’s where gold bulls should begin to worry, as the Investor Cycle headwinds mentioned earlier are likely to pressure gold as it attempts to break back over $1,200 and the 10 day moving average at $1,208.

Still keeping an open mind on the possibilities here, as technically the Cycle has not failed, which means both bullish and bearish options remain on the table. How gold performs after a quick rally in the coming days will be very important and ultimately it will reveal golds intentions for the remainder of the Investor Cycle. But we can’t ignore the bearish evidence now; I would give a failed Daily Cycle a 75% chance. Only a push over $1,232 can turn this into a bullish setup. Caution to the downside therefore, a failed Cycle opens the door to much larger degree declines.


5-28 Gold Daily

The Financial Tap publishes two member reports per week, a weekly premium report and a midweek market update report. The reports cover the movements and trading opportunities of the Gold, S&P, Oil, $USD, US Bond’s, and Natural Gas Cycles. Along with these reports, members enjoy access to two different portfolios and trade alerts. Both portfolios trade on varying time-frames (from days, weeks, to months), there is a portfolio to suit all member preferences.

You’re just 1 minute away from profitable trades! please visit: https://thefinancialtap.com/landing/try#

Feel free to share this post via the below social media avenues.

Some Breathing Room

Now that Gold has pushed to a three month high, it’s clear that my bullish read of the Gold tape is at least partially correct. In the face of recent negative price action, I had managed to remain cautiously bullish given Gold’s position in a new Investor Cycle – it was far too early for Gold to be rolling over, even if it remained locked in an extreme bear market. But now, after this week’s action, Gold is in a much better position, and with the possibility of upside ahead.  (Glossary of Cycle terms)

The market analysts who have been overwhelming bearish on Gold (many holding Shorts) are now in the position of potentially needing to play catch up, which would chase the market higher. We’ll be eagerly watching for upside confirmation, but for now, we’ll be content with finally gaining clarity on Gold’s Cycles.

With a comfortable Cycle count, we can construct a new framework of expectations. We know now that the current Daily Cycle is the 2nd of the Investor Cycle that began on March 17th. The first Daily Cycle was Left Translated – I’m not thrilled with that – but we have reached new highs in the 2nd DC, and there is plenty of room to the upside.

As a preview of a later section, the Investor Cycle shows that Gold has room to move higher, even if it remains in a down-trending bear market Cycle. So with favorable Cycle timing, I expect Gold to have at least one more decent rally before again confront the question of where Gold is headed. It should come when Gold reaches the intermediate term downtrend line that dates back to early 2014.

5-16 Gold Daily

The Junior Miners are looking great. I’ve studied Gold long enough to know that a healthy market for Junior Miners is always a bullish sign. Since Gold’s Investor Cycle Low (ICL) in March, there’s been a seemingly relentless accumulation of the Miners, and without a typical DCL decline. This is fairly uncommon for the Miners as they are high beta in relation to Gold, so a sell-off in the precious metals complex typically hits them much harder than Gold.

This behavior speaks to the potential accumulative bid under the Miners. Although it’s too early for grandiose claims, relative strength in the Miners is consistent with buying near a bear market low. In fact, the Miners have already gained 25% since the last ICL Gains like this are not unusual for an IC, but in this case, we’re only days into the 2nd Daily Cycle. In relation to Gold, the Miners have been especially impressive. Throughout the bear market, the Miners have led Gold, and have typically shown weakness right before a Gold Cycle turned down. In today’s case, the Miners are firmly leading Gold and the sector higher. As long as that dynamic continues, it is positive for Gold.


5-16 junior miners


The same can be said for sentiment; the COT report is bullish for Gold. No one has given Gold any chance of mounting a real rally, and 9 weeks into the Investor Cycle, short speculative positions are at levels near those typical for an ICL.

From the below chart, we see that Gold is still locked in a bear market trend, as marked by 5 long Investor Cycles. In looking at traders’ positions and the ebb & flow between being Short and being Long, the current Cycle is nowhere near a typical topping point. The timing between Cycle tops and troughs is fairly consistent, and the chart shows that Gold still needs a Short-covering rally before an IC top. This has been the behavior of the current bear market: Short-covering drives a final rally that fizzles once the Shorts have been exhausted.

If the bear market is over, once the Short-covering rally ends, Gold will transition into an organic rally based on wholesale speculative buying. This organic buying will be from traders who prefer to risk capital in Gold rather than other bullish assets. It’s a stretch to be even considering that possibility at this point, but it is worth mentioning as an illustration of the difference between buyers in bull and bear markets.


5-16 Gold COT


Since the beginning of 2015, there have been widespread calls for much lower Gold prices, with $1,000 and even $725 as popular targets. Gold’s current upside move has proceeded under the radar, and has managed to fool these bears so far. In the process, the Gold market is presenting my favorite type of rally, one where there is fuel remaining in the market to support a much greater move.

The COT report underscores this idea. Traders are still Short the Gold market while Gold sits at a 3 month high and on the verge of further upside that will force traders to begin covering their Shorts.

Longer term, remember that the March ICL held above the October ICL. With our newfound Cycle clarity, we no longer need to be concerned with the possibility of an early IC failure, so we can once again at least entertain the possibility that the bear market double bottomed in March. I believe that we’re about to see a Short covering rally from the speculators, one that will drive price up to the declining trend-line that marks the place where the last 5 bear market ICs topped.

Beyond that, further upside will require that speculators turn bullish and begin buying Long positions again. If that unfolds, we should expect to see Gold cleanly break and exceed the trend-line, and eventually push into the $1,300+ range, perhaps as high as $1,375. And if that happens, Gold will be in a new up-trend because of the double bottom ICL followed by a higher Investor Cycle top.  It would be an exciting development for long-suffering bulls!


5-18 public gold

The Financial Tap publishes two member reports per week, a weekly premium report and a midweek market update report. The reports cover the movements and trading opportunities of the Gold, S&P, Oil, $USD, US Bond’s, and Natural Gas Cycles. Along with these reports, members enjoy access to two different portfolios and trade alerts. Both portfolios trade on varying time-frames (from days, weeks, to months), there is a portfolio to suit all member preferences.

You’re just 1 minute away from profitable trades! please visit: https://thefinancialtap.com

Feel free to share this post via the below social media avenues.

Yen Troubles to Continue

A clear and decisive US Dollar Cycle pattern has emerged, and that’s always good news. We have a Daily Cycle that moved perfectly to both time and price expectations, and price is now poised to turn higher in a new Daily Cycle. With the Dollar at oversold levels not seen in well over a year, it is interesting to note that sentiment has quickly started to turn against the Dollar. From the perspective of a longer time-frame, it’s possible that this is also an Investor Cycle Low in the making.  (Glossary of Cycle terms)

5-2 Dollar Daily


Looking at this week’s COT report, we see that US Dollar Longs are at the lowest level since mid-December. Sentiment remains elevated overall, but a marked retreat the past few weeks has moved sentiment back to level that could support a new Investor Cycle rally in a bull market.

Of particular interest is the US Dollar to Yen COT report. It shows traders have entirely retreated from bearish bets against the Yen, and the net Short position is the least bearish since October 2012. Not coincidentally, the COT positioning in the summer of 2012 was the basis from which the Yen began a correction. I believe a good setup is presenting itself at present.


5-2 YEN COTSource: Sentimentrader.com


The structural problems in Japan are too great to ignore, and the Japan Central Bank is compensating for them by engaging in quantitative easing. I do not believe that the JCB thinks that QE is the best policy, but, rather, that it needs to buy its own debt due to a dearth of other buyers. The JCB has openly made it very clear that it will not stop buying debt, and the result of a massive balance sheet expansion can only be a huge realignment in the Yen versus other currencies.


5-2 Japan Balance sheet as percent of GDPSource: Goldman Sachs

A look at the weekly Yen index (below) shows that it has not rallied despite the Dollar’s falling for 8 weeks into at least a deep Daily Cycle Low (DCL). There has been no demand to push the Yen higher while the Dollar has fallen, unlike the Euro, which has staged a counter-trend move.

In addition, the MACD has been rising since Jan 2015, but the Yen’s price has remained flat. Because the Yen did not respond (higher) as the Dollar fell and as traders increased (COT) Longs and covered Shorts, I can only assume that a new leg lower is approaching. One more thing to note: extremely tight Bollinger Bands tell me that a big move is imminent.


5-2 Yen Weekly

light


Trade Idea: One could consider taking a Short Yen position at this point. The position could be a full Daily Cycle too early, because the dollar might have another Cycle of retracement before putting in a deeper Investor Cycle turn.  But because the Yen did nothing during the last (failed) Dollar Daily Cycle, a short Yen position here should hold above reasonable stops if the trade is a little early.  The idea is to capture what I believe is a larger degree Yen fall over a longer time-frame. (3-4 months).


The Financial Tap publishes two member reports per week, a weekly premium report and a midweek market update report. The reports cover the movements and trading opportunities of the Gold, S&P, Oil, $USD, US Bond’s, and Natural Gas Cycles. Along with these reports, members enjoy access to two different portfolios and trade alerts. Both portfolios trade on varying time-frames (from days, weeks, to months), there is a portfolio to suit all member preferences.

You’re just 1 minute away from profitable trades! please visit: https://thefinancialtap.com/landing/try#

Feel free to share this post via the below social media avenues.

Crude Bull Market Hope

I believe that energy analysts are absolutely delusional to think Crude production will slow significantly, especially with Oil back near the $60 mark.  During the recent, lengthy bull market, tens of billions of Dollars were invested in Crude infrastructure, so there is too much at stake to simply shut down operations and walk away.  Investors and participants in any industry that has experienced a 15 year bull market won’t change their beliefs overnight – it takes time for sentiment to shift.  Most are far too emotionally and financially vested in the industry, so it’s unreasonable to think that a 9 month decline is going to drive an immediate adjustment to the imbalance in supply and demand.

Granted, Oil will see some immediate production cuts, but these will be temporary in nature.  They are not long term oil field closures, but rather decreases (or cessations) in the expansion of wells.  Once we see some price recovery – as at present – companies will quickly react and start drilling again.  Unfortunately, similar to the Gold bear market, I believe that this is the beginning of a long and arduous grind lower over a number of years.

In the short term however, there are positives to report.  The fact that Crude barely responded (lower) on Friday to a fairly decent sell-off in Equities suggests that the move higher has further to go.  The current Daily Cycle is clearly Right Translated, and there is pent-up demand here after 9 months of massive declines.  I expect that the counter-trend action is currently too powerful to end, so Oil should continue to move higher.  The next Daily Cycle top might not come until after Day 30, so there could be another 2 weeks of upside ahead.


4-18 Crude Daily


On the weekly Cycle, the chart is as clear as they come.  After a long, savage bear market crash, Crude briefly recovered, only to quickly drop again and suck in as many bears as possible.  The subsequent rally, which many are calling a new “bull rally”, should continue higher for some time.  But once the Investor Cycle eventually tops, the drops should lead to bulls being slaughtered again.

I believe that the 10 month decline that we witnessed is now over.  That move has run its course and a new Yearly Cycle is underway.  I don’t necessarily believe that new lows need to occur quickly, but I do believe that the upside should be capped and that, by the end of this Yearly Cycle, we will see Crude back near the $30-$40 level.


4-18 Crude weekly

Possible Trading Ideas

Longer term traders could pick up positions (Long) looking towards a June high in crude prices.  Although in my opinion, the risk/reward is not all that favorable and they would need to be prepared to weather some volatility.  Remember that the crude market is still under a new bear market influence.

For the short term trader, the next trade consideration would be to short crude around my price target $60-$62.  But you would need to ensure that the Daily Cycle is advanced enough in the timing band for a good Short trade.  And now that we’ve seen an upside breakout, making this a Right Translated Daily Cycle, we should wait until a price reversal after Day 30 (currently on Day 23) before considering a Short trade.  So it is unlikely we’ll be looking at a trade this week.

The Financial Tap publishes two member reports per week, a weekly premium report and a midweek market update report. The reports cover the movements and trading opportunities of the Gold, S&P, Oil, $USD, US Bond’s, and Natural Gas Cycles. Along with these reports, members enjoy access to two different portfolios and trade alerts. Both portfolios trade on varying time-frames (from days, weeks, to months), there is a portfolio to suit all member preferences.

You’re just 1 minute away from profitable trades! please visit: https://thefinancialtap.com

Feel free to share this post via the below social media avenues.

A Gold Trading Idea

Yesterday’s FOMC was bullish for most assets, as the FED indicated it was not ready to beginning raising rates. The FED’s ZIRP policy, designed primarily to encourage lending and speculative asset purchases, is clearly here to stay for a while longer. But for gold, this policy has done little for it over the past 3 years, as speculative money is much more concerned with chasing equity and bond markets higher.

Which is why we should be careful here and to avoid reading into a solitary $20 move on a bullish FOMC day. For starters, the dollar fell by a massive amount, this alone accounted for much of the gold increase. But also more importantly, gold was extremely oversold, being down for 12 of the 13 preceding sessions. Therefore, there was an expectation for gold to move higher yesterday, the asset was setup and ready to rally on almost any excuse.

3-18 Gold Daily

As I outlined with much more detail (premium report) this past weekend, the Cycle timing is simply not right for a sustained rally.  A combination of (early) Weekly Cycle timing, gold sentiment, and the COT report, all show evidence to support an Investor Cycle Low that is just a shy too early. I also cautioned members to be on the lookout for a “suckers rally”, and not to confuse it with a new Investor Cycle rally.

So as yesterday’s move higher was expected, it is also likely that gold will continue higher for the coming days and the action to appear convincing.  However, as gold recently entered into the final chapter of this Investor Cycle, it is unlikely to have the strength required to get beyond $1,200. Traders should be on the lookout for a peak around the $1,180-$1,200 from which they could short the gold Cycle, because the decline from that peak should be of the “capitulation variety”.  The good news is that if we’re incorrect on this Cycle outlook, then gold only needs to exceed $1,223 (prior Cycle high) to prove us wrong.


The Financial Tap publishes two member reports per week, a weekly premium report and a midweek market update report. The reports cover the movements and trading opportunities of the Gold, S&P, Oil, $USD, US Bond’s, and Natural Gas Cycles. Along with these reports, members enjoy access to two different portfolios and trade alerts. Both portfolios trade on varying time-frames (from days, weeks, to months), there is a portfolio to suit all member preferences.

You’re just 1 minute away from profitable trades! please visit: https://thefinancialtap.com

Feel free to share this post via the below social media avenues.