Reminiscent of Pompeii

We’re at the point in the equity bull market Cycle that every piece of news is construed as positive for the equity markets. In many cases, the news even appears to accentuate positive possibilities. The speculative nature of the current advance has by now captured the vast majority of market participants; the media and the pundits are no exception.

For example, the markets were pushed higher last week by several news events, even though the headlines hit the same themes that have been recycled for the past 3 years, and that are almost certainly, by now, fully discounted in prices. The news events included Japan calling off next year’s planned sales tax increase, China surprising with an interest rate decrease, and the ECB announcing that they will be buying assets. These are all related to the tired narrative that central banks and related authorities can alter the natural long term pricing/valuation trajectory of the markets. The world’s equity markets soared on the announcements, and in the process completely ignored the weak fundamentals that gave rise to them. The S&P and Dow even reached new all-time highs, in general very bullish developments. But in this case, the gains were built upon the shifting sand of sound bites rather than economic fundamentals.

The economic reality behind the announcements is anything but positive. To start the week, Japan surprised the world by declaring that it has – again – entered into recession. In addition, China’s HSBC manufacturing index fell to 50, a six-month low, burdened by an extremely high level of non-performing internal debt from overbuilding. And in Europe, the economies are tottering on the brink of recession, while inflation is very close to turning negative. Even in the U.S, where the landscape is relatively better, industrial production fell 0.1% and the Markit manufacturing PMI hit a 10 month low.

It’s clear that the meddling of the world’s central banks is in response to a rapidly deteriorating world economy. And equity markets, if not the underlying economies, are responding. For now, equities are choosing to ignore the fact that the patient – the world economy – is sick, and that these policy changes are only artificial responses to symptoms, and are far from cures. Central banks may have the ability to artificially raise asset prices, but it is only temporary. The idea behind current central bank actions, that higher asset prices create a “wealth effect” that will become self-sustaining and spur economic growth, ignores two key facts: world economies are laden with high, non-performing debt, and the economies’ problems are structural in nature.

In Japan, an easy-money policy has failed for 20+ years due to a highly inefficient domestic economy. Since 2008, when foreign consumers stopped buying cheap Chinese knock-off consumer goods on credit, China has bridged the economic gap through trillions of Dollars of debt used to fuel construction projects. The debt is largely non-performing, and its creation has led to a speculative bubble in real estate as well as massive oversupply. Adding to the world’s troubles, Europe is structurally a political and regulatory nightmare, with a banking system that’s holding huge amounts of bad loans. The European banking system is woefully under-capitalized and is not in a position to extend additional credit.

These problems are structural and can’t be fixed with liquidity, so pumping additional cheap money into these economies is not a solution. Money can be created through cheap credit, but money velocity cannot. Until we see a real business cycle downturn, one in which non-performing debt is finally expunged from the system, we will never have a foundation for organic economic growth and an expansion of GDP. In short, the world needs to experience a fair amount of pain before it has the potential for real gain.

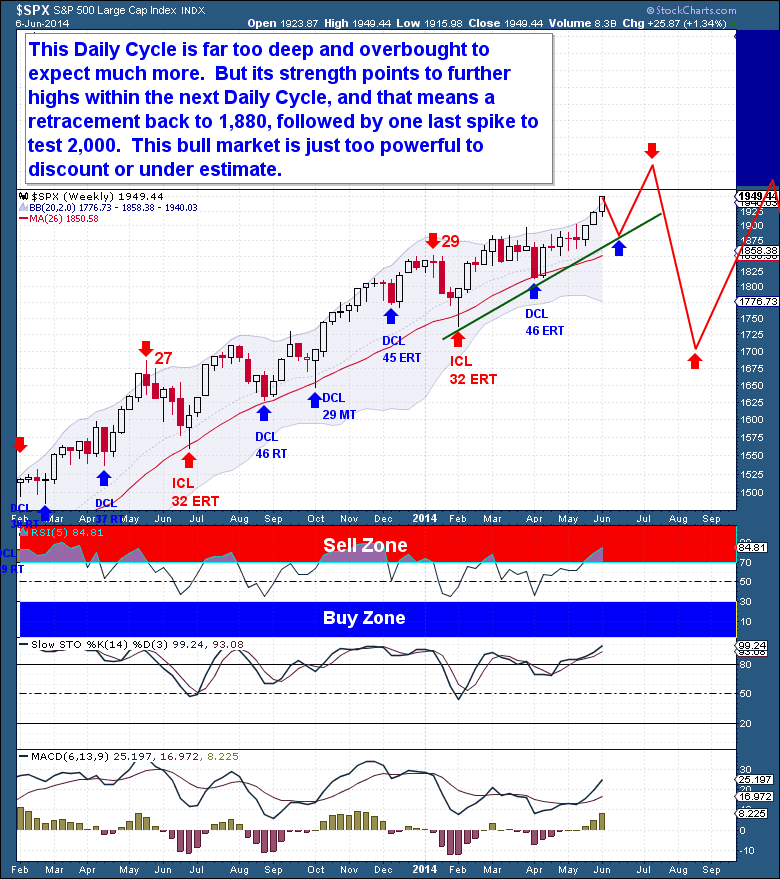
The implications for world equity markets are significant. Given the world’s poor economic fundamentals, equity markets at current levels are both artificial and unsustainable. They are far from reflecting the current economic state and, more importantly, are completely misaligned with future risks. Once the business cycle turns lower again – as it inevitably will – the market will collapse on itself and will be seen to have been hugely, woefully overpriced. The market re-pricing which occurs during these periods is always severe and generally swift. It’s the market’s mechanism for closing the imbalance between prices at the peak of speculative fever, and the market’s intrinsic value.  But since pricing imbalances often work both ways, during true secular bear markets, prices (valuation) typically fall well below a market’s true value.

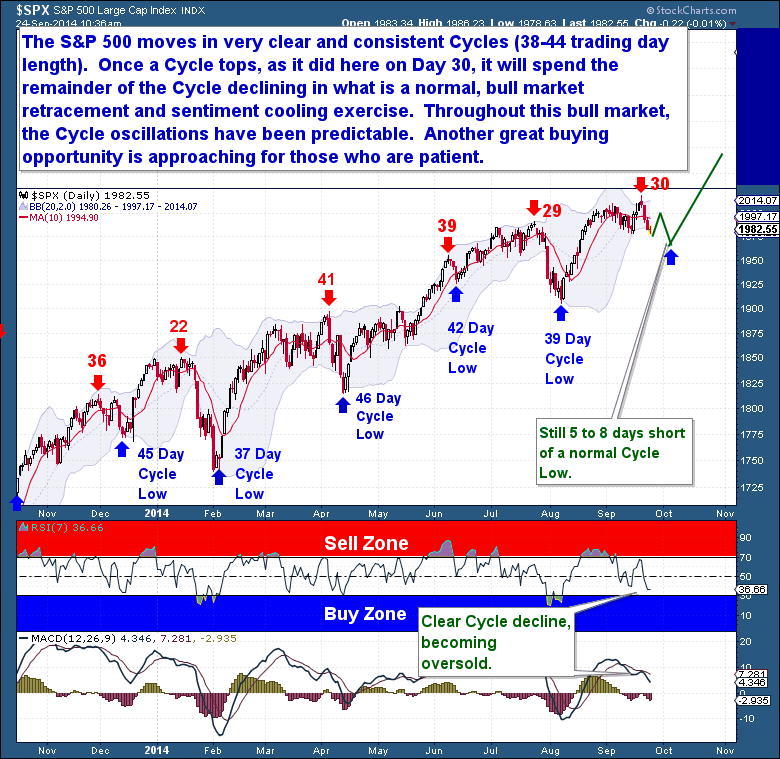
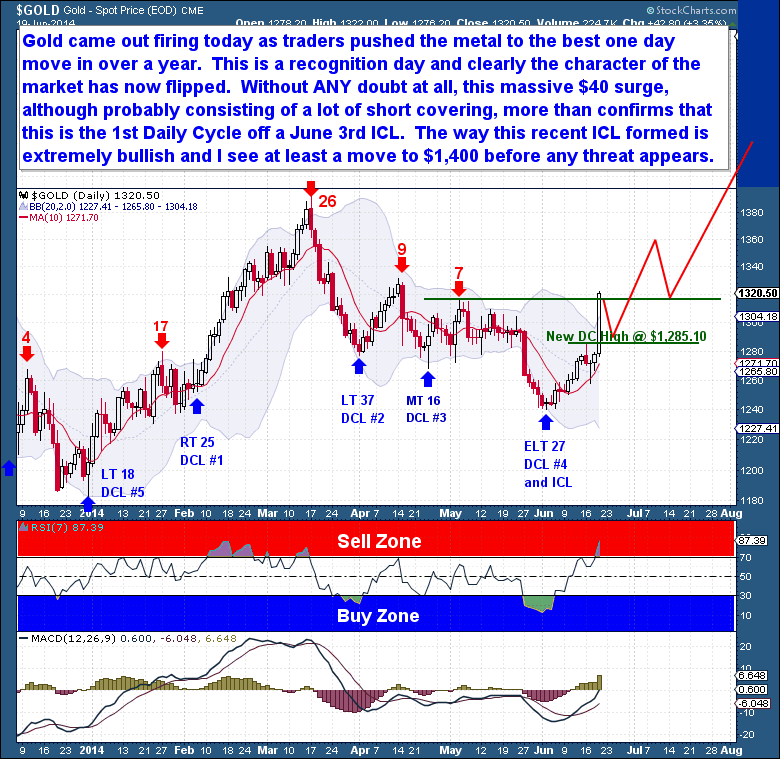
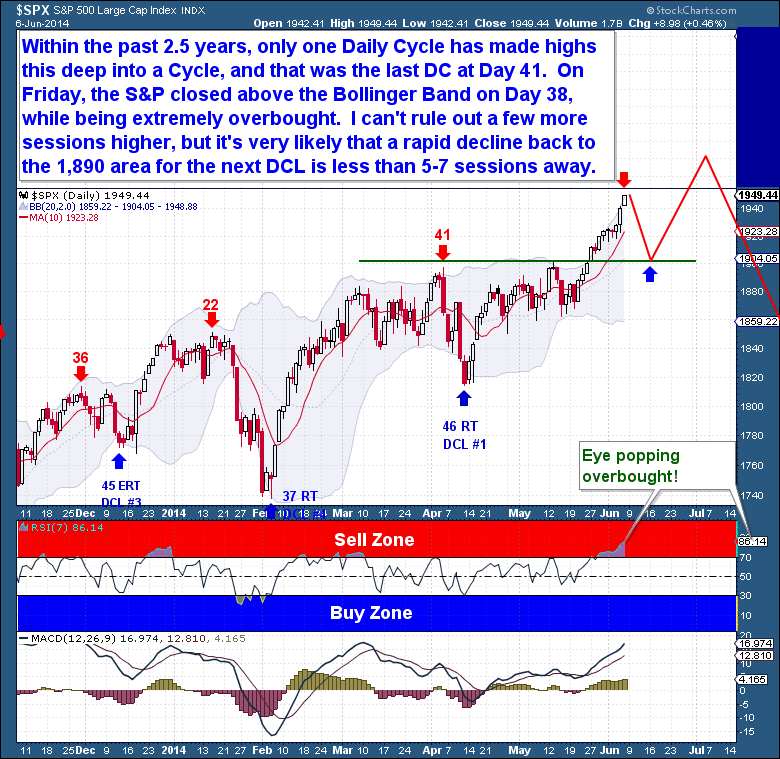
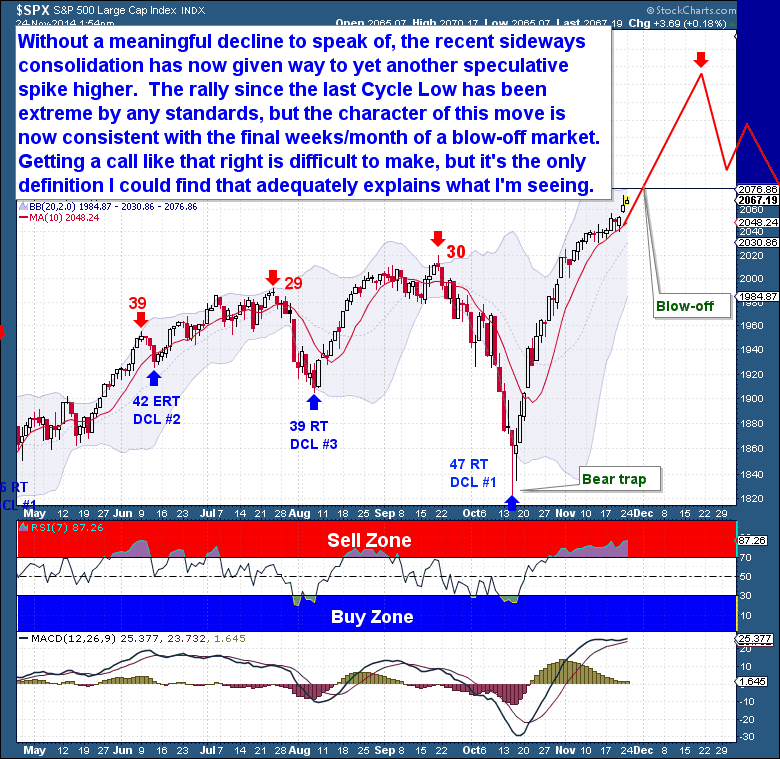
Markets are often ignorant of what lies directly ahead, and I believe that’s the case with equities today. After a relentless move higher, the recent sideways consolidation has given way to yet another speculative spike higher. The rally since the last Daily Cycle Low has been extreme by any standard, but the character of the current move is now consistent with the final weeks of a blow-off top.

Calling a top is difficult at best, and I’m much less interested in being right about a top than I am in generating grounded analysis and presenting it well to readers. In this case, it’s hard to see the current spike in equities as anything other than a blow-off move into a final top. It’s the only description for what the equity markets are doing.  Blow-offs end with a final exhaustive peak, we’re not there yet.  And to be perfectly honest, I’m not sure exactly when it will peak…only that it’s likely to be in the coming month.  A possible clue is the length of the typical Daily Cycle, roughly 40 to 45 trading days in total.  If this breathless trajectory continues, then this Cycle is likely to mark that peak.  As it’s already on Day 27, that Cycle top is just another 13 to 20 sessions away, just in time for the holidays.


S&P 500 Blow off top - The Financial Tap

The Financial Tap publishes two member reports per week, a weekly premium report and a midweek market update report. The reports cover the movements and trading opportunities of the Gold, S&P, Oil, $USD, US Bond’s, and Natural Gas Cycles. Along with these reports, members enjoy access to two different portfolios and trade alerts. Both portfolios trade on varying time-frames (from days, weeks, to months), there is a portfolio to suit all member preferences.

View the Site: The Financial Tap

You’re just 1 minute away from profitable trades! please visit: https://thefinancialtap.com/landing/try#

Feel free to share this post via the below social media avenues.

Has the Trap Been Set

We finally have some movement within the gold complex, and for a welcomed change, it’s to the upside. It has been dicey lately, as the back and forth daily swings have been unnerving. It’s not common within bear markets to see an asset form a Cycle Low and then just take off to the upside. This is why anyone trading the precious metals sector needs to understand that the Long traders carry with them a lot of anxiety. Past experiences have them guarded, which is why we see these frequent quick intra-day reversals…they’re spooked far too easily.

Fortunately, we are into the timing band for these big Cycle Low events now. Within this report, I bolster the idea that we’re seeing evidence to support these lows as having pasted already. Shifting the main question now away from whether we have new Cycle’s in play over to a discussion on what these Cycles could potentially bring.

Almost since the day it occurred, I have expected the big surge back on Nov 7th to be marked as a Daily Cycle Low (DCL). And with Friday’s repeat (upside) performance of the prior Friday, the $30 move finally marked a Daily Swing Low and a clean break of the declining trend-line. Along with the clear and bullish rise in our technical indicators, it’s safe to say that gold is into a new Daily Cycle.


11-15 gold daily

The miners are confirming this gold move and are encouragingly leading the Cycle again. The back and forth volatility this past week was worrying; in the sense they were showing us a potential gold decline was at hand. The mini triangle pattern, resulting from all this volatility did eventually resolve itself, with the miners convincingly breaking higher as confirmation gold was in a new Daily Cycle.

I’m encouraged by the action within the miners because back on Nov 5th they did find a low 2 days before gold did. The sell-off they experienced, leading into that low, was of the extreme capitulation variety seen only during major (Yearly and Cyclical) Cycle turns. And because we’re in the timing band for a gold Investor and Yearly Cycle Low, this early recovery off a 40% “crash” is suggesting that we have found, in the least, an Investor Cycle bottom.


11-15 GDX daily

I presented the below gold to miners ratio chart a few weeks ago (members site) as a way to represent just how much the miners had been sold relative to gold. I find this chart important, not because it necessarily predicts where gold is heading, but that during major declines, the miners are sold-off indiscriminately and with extreme prejudice.

It is clear from the chart that relative to gold, the miners became the most undervalued in over 20 years. Having already decline some 65% up until this past summer, the miners since crash another 40% within the past 8 weeks, a classic capitulation event that I can only equate to events on (or bigger than) the scale seen during the 2000 and 2008 bear market lows. I’m showing the chart again because the reversal shown by the miners this week holds promise of a much bigger turn. In all past cases, reversals on the ratio chart after massive vertical peak have always marked at least a Yearly Cycle Low.


11-15 Gold to miners ratio

So we have rock solid action to support a new Daily Cycle. But on the weekly chart, that new Daily Cycle barely registers, except that it shows up as a pair of bullish hammer candles comfortably into the timing band for a Cycle Low. Although we can project our expectations, based on this ancillary evidence, the reality is that it just takes patience when waiting for actual confirmation of a new Investor Cycle.

At this point, seeing a new Daily Cycle is encouraging, because it holds the promise of marking a Cycle Low at the longer time-frames too. A DCL is after-all a prerequisite for any new Investor and Yearly Cycle Low, they are intertwined. Although the move so far has been (intra-day) volatile, gold has managed to close out the week with a Weekly Swing Low in place. The foundation stones have been laid.


11-15 Gold Weekly

What I like about this move is that nobody expects it to do much or go far. A long and punishing bear market has set the scene for a much larger counter-trend rally here. Yes, obviously caution is recommended, a bear market surprises to the downside with uncanny and unforgiving consistency.

But I like the setup, because it’s exactly the type of contrarian environment that should support a powerful counter-trend rally. I particularly like the fact that gold dropped below the June 2013 lows, that technical break-down automatically turned a large percentage of technical traders against the sector. In past reports, over a month ago (see chart below from public post “Gold Will Surprise in More Ways Than One“, I had stated that losing the June 2013 Lows was potentially the more bullish scenario, because that development offered up the potential for a significant bear trap. I have found that many bear markets end on such technical break-downs, as the break-down encourages so many more speculators to join the foray on the short side. It’s akin to that final vertical spike in a bull market.

“Bear traps often proceed major market moves” – Early Oct chart.


Gold Oct bear Trap

As a result of seeing fresh 4 year lows, the COT report shows that a significant gold short position has amassed. We’re at the level (near record) where Cycle Lows form, mainly because the position again gold is such that little further upside will set off a massive short squeeze. I always try to end with a balanced viewpoint, which is why I will remind everyone that the bear market demands respect. But it’s been all down for so long and it’s time for the Cycle to reverse. Form what I can tell, a new Investor and Yearly Cycle rally is now in progress, this outlook I favor with much more confidence this week.

The Financial Tap publishes two member reports per week, a weekly premium report and a midweek market update report. The reports cover the movements and trading opportunities of the Gold, S&P, Oil, $USD, US Bond’s, and Natural Gas Cycles. Along with these reports, members enjoy access to two different portfolios and trade alerts. Both portfolios trade on varying time-frames (from days, weeks, to months), there is a portfolio to suit all member preferences.

View the Site: The Financial Tap

You’re just 1 minute away from profitable trades! please visit:  https://thefinancialtap.com/landing/try#

Feel free to share this post via the below social media avenues.

Crude Oil is Hitting Bottom

In the past, we’ve discussed at length the structural problems facing Crude. So the pressure the energy markets are under, both from the demand and supply sides, should come as no surprise. This double whammy to the Crude market is not likely to be resolved overnight; demand-supply issues require time to work through a market.

Through hydraulic fracking and a massive influx of investment capital, the US has again become a major oil producer. But it’s the speed with which new supply from the US has come on line that has taken the market by surprise and rocked prices.

The 4 million plus barrels of extra oil that the US is suddenly producing is causing a problem for exporters like Saudi Arabia, who now need to find new markets for their oil. Most of the world’s oil is not sold in futures contracts for delivery one to three months out. Rather oil contracts are long term in nature, made over 1 to 3 year periods. And the competition for existing oil markets has been fierce, forcing suppliers to drastically cut their prices relative to spot.

As the price of oil begins to fall, oil producing nations, most of whom are ill-equipped to handle sub-$80 pricing, will likely try to offset the revenue lost through lower prices by raising their production. Saudi Arabia, the only nation capable of meaningfully cutting production, has stated that it will likely increase production to maintain its revenue levels. The other nations capable of possibly cutting production are Iraq, Iran and Venezuela, but all have economic issues that make any cut (without general consensus) very unlikely.

This should only perpetuate the glut of supply into 2015, setting the scene for much further declines in price as the markets are faced with continuing demand problems. If the European recession turns into a continent-wide event, its impacts on the world economy and, by extension, the demand for oil will put Crude prices under even more severe pressure.

Judging by the Daily chart reversal in the energy stocks in the past 4 days, there is a good chance that Crude has finally hit (an intermediate time-frame) bottom. As outlined earlier, I’m not bullish on Crude’s longer term prospects, but the current sell-off has been severe, and is likely over for now. Given the uncertainty in the Crude markets, we need to see a close above the 10dma and Crude to form a Swing Low ($84.93).  Once that occurs, it’s likely that a counter-trend bounce will move price back to at least the $90 level.


10-22 Crude Oil

This sell-off has been extreme and much deeper than a standard ICL. The depth of the energy sector sell-off is on par with the last, big general market correction in 2011. The entire sector is now extremely oversold and should experience a decent rally during the next few weeks. But as in 2011, we don’t know is whether the current move down is just the beginning of a deeper decline.


10-22 Energy Bullish Percent Index

Crude’s weakness isn’t surprising – sentiment has collapsed to near record low levels, below even those from late 2008. Based on the overdue nature of Crude’s Investor Cycle Low, extremely low sentiment readings are suggesting that, at the very least, a new Investor Cycle (this Cycle averages 20-24 weeks) rally is about to begin. In the past, at similar sentiment levels, a sell-off comparable to what we’ve seen would have marked the low for the Yearly Cycle. So as with the equity markets, Crude is seeing lows deep enough to spawn a multi-month rally. But we also have evidence that suggests that a structural decline is now in progress.


10-18_Crude_Sentiment

It’s clear that an extended 46 week Cycle is (or has already) coming to an end. The final 3 weeks yielded $12 in declines, clearly Yearly Cycle capitulation selling. If it hasn’t happened already, a new Investor Cycle will soon launch, so we’re faced with two questions: just how far the current Investor Cycle will rally, and whether a longer term bear market has arrived.

The presence of a new series of lower tops and lower lows on the Investor Cycle chart is suggesting that 2015 is likely to be a very challenging period for the energy markets. Like all assets, energy moves through Cycles of varying time-frames. I believe that the record investment of the past 5 years has resulted in too much production, which will lead to a period of business consolidation and bankruptcy.


10-18 Crude weekly

The Financial Tap publishes two member reports per week, a weekly premium report and a midweek market update report. The reports cover the movements and trading opportunities of the Gold, S&P, Oil, $USD, and US Bond Cycles. Along with these reports, members enjoy access to two different portfolios and trade alerts. Both portfolios trade on varying timeframes (from days, weeks, to months), there is a portfolio to suit all member preferences.

You’re just 1 minute away from profitable trades! please visit https://thefinancialtap.com/landing/try#

Feel free to share this post via the below social media avenues.

Cycle Failures Point to a Market Correction

The equity markets are finally seeing action that has even the most hardened bulls running scared. In the past, I’ve been quick to dismiss selling periods – Cycle Lows – as natural regression-to-the-mean events. In a bull market, an oscillating Cycle pattern of two steps forward and one step back is what drives an asset higher. But this time is different…two steps back is completely out of character. So much so, that I now believe that the 3.5 years bull market is now in serious trouble.

If we were to look for reasons to explain the recent selling, there are plenty to be had. The most likely is not a specific piece of news or single data point, but that the collective herd of market participants is fickle and can be easily spooked. The current bull market has broken plenty of records, including the length of time – more than 3 years – since a 10% correction. This has resulted in double-digit market gains for consecutive years, and a near vertical rise over a sustained period of time. Against the backdrop of a soft world economy, this performance is nothing short of remarkable.

What are potentially playing out are the very beginnings of a market turn. We could soon experience an environment of reversing psychology, where all tidbits of news will be construed as negative for the markets. It takes a lot of confidence (and ignorance) to elevate and sustain a market at present levels, especially one built on blind faith and the idea that the FED can keep the market elevated into perpetuity. This has bred a level of speculation, and arrogance, often seen at the top of longer dated Cycles.

If we need a catalyst for a potential market sell-off, we need only look toward Europe. Although the EU is just one market in the inter-connected global economy, it still makes up almost 25% of world GDP. And it’s large enough that any issues will send shock waves through world markets.

The EU’s problems are structural in nature, with too much government red tape, inefficient and constrictive regulations, and a labor policy that is not consistent with a rapidly-changing world economy. In addition, EU leaders have made poor choices of late. In particular was the instance on excessive austerity at precisely the wrong time in the Business Cycle. Austerity is choking what little life remains in the European economy, and is consuming capital needed to support investment and growth initiatives. The time to pay down debts and reign in spending is during good times; doing so gives the flexibility to loosen the reins and deficit spend during bad times.

What’s developing in Europe is a negative economic feedback loop comprised of declining sales, lower production, declining income and lower employment. This is compounded by a general lack of leadership across the continent, and a flawed, unworkable economic union. The northern countries have been somewhat sheltered up to this point, primarily because the single currency has been very advantageous to them versus the consumption-focused economies in the South. In addition, France has faltered recently and has now made it clear that it cannot adhere to a capped budget while the economy shrinks.

Technically, the stock market is often months ahead of the general economy when it comes to predicting economic recession. Although the German market is near all-time highs, a failed cycle has developed. This is very likely associated with a market that has topped. On the below weekly chart, the first sign of a top was the Cycle failure in August. The market’s inability to rally to new highs in September was a failed opportunity to negate the August Cycle failure. But the nail in the coffin for German equities was Friday’s plunge, which took the index below the August lows and created another failed Cycle. Multiple failed cycles are exactly how markets top and turn over.


10-11 DAX

Here in the US, Equity Cycles are also showing similar technical damage. Technically, the great bull market is still intact, and a short-term rally is more than overdue.  But to see this 1st Daily Cycle (normally the most bullish Cycle) retrace more than 100% into a failed state, is very odd behavior. A Cycle failure with increased volatility can only be seen as a significant change in character for the bull market, which is why I’m very concerned that the 3 year bull run is coming to an end. With other markets such as the DAX and Russell also showing Cycle failures, we need to strongly consider the possibility that a Left Translated Investor Cycle is in development.


S&P 500 Daily Cycle Low - Market likely topped

I’m trying to balance bearish evidence (that is suddenly very evident) with what remains a bull market of historic proportions. In 2013 and 2014, the bull market needed to be respected, but was clearly on borrowed time. Because the bull market was not based on fundamentals, and with the market extremely extended, once the market tops, a correction is likely to occur within a very short period of time.

Because the S&P has retraced more than 100% of the Daily Cycle, within the first Daily Cycle, we now have a confirmed Cycle failure on the Weekly chart too.  This is likely to be confirmation that the Investor Cycle has topped and 3 long months of declines are ahead for world markets. Of course, it’s never a straight move down, the market is significantly oversold here, so the expectation will be for a rally back toward the 50dma (the 1,975 area).  Such a rally would occur as part of the 2nd Daily Cycle, but that rally should fail to make new highs since the market failed to hold the August lows at 1,904 next.


S&P Weekly Cycle in decline

The primary reason for my bearishness is that Cycle failures in all of the major indices (NASDAQ, Russell, S&P and DAX) are leading indicators of a broader market top. And with that evidence in mind, the below monthly chart of the S&P is confirming that divergences are likely a prelude to a move lower into a Yearly Cycle Low. But to be clear, this isn’t a call on the health of the bull market that began in 2009. Even a market correction (-10%) in the coming months will not be enough (at this point) to alter my view of the bull.

On the below monthly chart, the S&P has fallen below a very well-defined 36 month rising wedge. Losing a channel of this size, along with the Cycle failures, are signs of real market trouble. The breakdown in the technical indicators is also indicating that this is the beginning of a multi-month decline.  An Investor Cycle failure is always a prerequisite for a Yearly Cycle top, and a week 6 Investor Cycle top (see chart above) fits well with how Yearly Cycles normally come to an end. A week 6 top also allows for at least 12 more weeks before this Investor Cycle concludes, meaning we’re likely to experience a fast, step-down process lower into the next Weekly and Yearly Cycle Lows in early 2015.


S&P market top

The Financial Tap publishes two member reports per week, a weekly premium report and a midweek market update report. The reports cover the movements and trading opportunities of the Gold, S&P, Oil, $USD, and US Bond Cycles. Along with these reports, members enjoy access to two different portfolios and trade alerts. Both portfolios trade on varying timeframes (from days, weeks, to months), there is a portfolio to suit all member preferences.

You’re just 1 minute away from profitable trades! please visit https://thefinancialtap.com/landing/try#

Gold Will Surprise In More Ways Than One

Everywhere you turn today, gold is again being dismissed as a relic of the past, totally worthless, non-producing, with no place in any modern day portfolio. During the past 3 years, the gold complex has experienced the progressive stages of fear, capitulation, and despair, all classic bottoming phases of a long term Cycle. The question now is whether this high level of apathy is a symptom of a new secular bear market or a period of “stealth smart money” accumulation.

As an analysts of market Cycles, I’m encouraged by extremes in sentiment, as it correlates well with major Cycle turns. An asset’s price is just a reflection of the collective markets willingness to own it, so it naturally oscillates in response to changing sentiment, over a predictable period of time. Each ebb & flow of a Cycle may not repeat the last, but they sure do rhyme and they are as natural as breathing.

This brings us to the current Weekly Cycle, now standing at week 17 and in the early portion of the timing band for a Cycle Low. We know from experience that the final days of a Weekly Cycle can be thrilling; at times gold could lose $100 in the final 3 sessions. And that cannot be ruled out here, nobody can predict gold’s price movements over short periods of time. What we have is an asset that is in the timing band for a Daily and Weekly Cycle Low, sentiment at extremes, a COT report that is bullish, and miners that are showing relative strength. This is the very environment that spawns new Cycle rallies, not the setup for sustained declines.


Gold Weekly Cycle

I have been bearish for a while, for good reason, and I’ve been joined by most analysts of late as gold has fallen further. We’re seeing this reflected within extremely low (the 2nd Lowest of the past 15 years) sentiment numbers. Almost all financial analysts now expect to see a massive breakdown within the gold complex. And the recent Cycle failure and 4+ year lows within Silver has many expecting gold is just a step or two behind.

On the surface, this theory makes a lot of sense, the trend is lower. Gold is behaving in such a way that one can realistically expect a waterfall decline to quickly develop. But before we can entertain that idea, we must consider that this viewpoint has become a far too “scripted” notion. Setups that are so widely circulated and discussed, especially with sentiment at such levels, rarely ever develop that way.

To seriously consider a bear market continuation (from the 2011 top) or waterfall decline, we need to be aware that such developments require room (technically) and time (Cycle count) to transpire. In both cases, this is not an ideal position from which a significant gold sector breakdown could occur. The current deep Cycle count of the Yearly Cycle, the sentiment and technical readings, and even the U.S dollar’s massively stretched and overbought position do not support a sustained gold collapse.

Instead, what we should consider and focus our energy on is the coming Yearly Cycle Low, rather than what is likely to occur in the coming week or two leading up to that low. This current 15 month basing pattern is obviously very important because it is the foundation from which the significant move will be based from. At this time, we don’t know if the that move will be a continuation pattern lower or the next leg higher.  However in both cases, gold’s first surprise is that a significant Yearly Cycle rally is about to begin.


Gold Yearly Cycle

Notice how on the monthly chart above, the last 2 Yearly Cycles topped (red arrows) on month’s 4 and 2 respectively, that’s bear market behavior. Both were comfortably Left Translated, meaning that they topped early (Left of Center) and spent the most part of the Yearly Cycle in decline. But in each case, we still witnessed at least an 8 week rally to start each Cycle, in both cases adding at least $300 before topping. Yearly Cycle Lows occur only every 13 to 16 months and by definition coincide with the end of a (shorter) Weekly Cycle. What the evidence clearly shows is that we’ve come to another Weekly Cycle Low juncture, just as the Yearly Cycle is ready to turn here on Month 16.

The point here is that a (quick) loss of the $1,179, June 2013 lows within the next few weeks is a real possibility.  But that reversal will mark the end and the beginning of a new Yearly Cycle. As shown earlier, even within a Bear Market, we see violent counter trend rallies; this coming Yearly Cycle rally should be no different. This rally will dominate the remainder of 2014 and take many people by surprise.

It won’t be until the 2nd or 3rd month of that rally that our next gold surprise will come.  We will need to reconsider at that point whether this current 15 month Yearly Cycle basing pattern was just a continuation pattern (Bear Market) or a basing pattern (Bull Market) to support the next up-leg. It’s at the 2 to 4 month period where a bull or bear market will reveal itself again.

I could offer you an opinion as to where I believe gold is headed in 2015, but I see no point in making such brash predictions. My only concern is with where gold is headed in the intermediate future, that’s where the trade lies today. I will leave it to others who can do a much better job of entertaining you with lofty (biased) calls.

The Financial Tap publishes two member reports per week, a weekly premium report and a midweek market update report. The reports cover the movements and trading opportunities of the Gold, S&P, Oil, $USD, and US Bond Cycles. Along with these reports, members enjoy access to two different portfolios and trade alerts. Both portfolios trade on varying timeframes (from days, weeks, to months), there is a portfolio to suit all member preferences.

You’re just 1 minute away from profitable trades! please visit https://thefinancialtap.com/landing/try#

Patience is Always Rewarded

Overall, in any bull market, the trend is always your friend. But a favorable trend doesn’t mean any buy is automatically a good risk/reward trade. For the long term investor, a bull market can be forgiving of any entry. But for the swing trader with a short term focus, it’s buying the dips that present an opportunity to establish a profitable position, with far less risk. Of course, nothing is risk-less, but the ability to buy after a decent retracement should not be passed up.

During well trending markets, almost all declines are simply retracements and profit taking events. Besides the deeper (5%-10%) weekly Cycle retracements, which occur consistently twice a year (Every 24 weeks), these dips are just mean reversion events back towards an up sloping trend-line. As a Cycle becomes overly bullish and latecomers encouraged buying high, it’s around that point where the smart money (buyers of the prior dip) begins offloading their stock.

It’s this ebb & flow action that produces Cycles with predictable frequency. The S&P 500 moves in these Cycles every 38-44 trading days and their recent pattern can be clearly seen on the chart below. Beyond this chart, this entire bull market has exhibited similar consistency.


Financial Tap S&P 500 Cycle Decline

This current Cycle clearly topped 4 sessions ago on Day 30 (since the last Cycle Low) and now the profit taking and sentiment clearing process of the Cycle is in full swing. This type of retracement is normal and expected, as 30 days higher will now be followed with 8 to 12 sessions lower, to complete this Cycle.

Understanding that markets move in such a predictable flow allows the trader to remain patient with their entry. It provides them the opportunity to sit back and wait for the trade to develop, as opposed to being constantly on edge and concerned they’re going to miss the next opportunity. And yet another of these Cycle Low buying opportunities is approaching. To profit from it, it will require you to be emotionless when confronted with daily swings and high volatility, while remaining fixated on executing your trading plan.
The Financial Tap publishes two member reports per week, a weekly premium report and a midweek market update report. The reports cover the movements and trading opportunities of the Gold, S&P, Oil, $USD, and US Bond Cycles. Along with these reports, members enjoy access to two different portfolios and trade alerts. Both portfolios trade on varying timeframes (from days, weeks, to months), there is a portfolio to suit all member preferences.

You’re just 1 minute away from profitable trades! please visit https://thefinancialtap.com/landing/try#

Few Believe Gold Can Shine

Considering that Gold has risen $80 off its low and the precious metals Miners have screamed higher, it's surprising how little bullish cheering we've heard.  My discussion forum, Bull & Bear Talk, is very sensitive to Gold, but has barely seen an uptick in traffic during this move.  In past moves out of Investor Cycle Lows, Bull and Bear Talk has had an immediate surge in traffic and a significant rise in the number of excited posts. This is just a small sampling of sentiment, but I think it's telling.  We've had a 3 year bear market in Gold that has battered and beaten the bulls into complete submission.  All speculative interest and fond memories of the past bull market have been completely erased.  This lack of interest was evident in the recent 3rd test of the bear market low - the volume and volatility was much lower than during the first two retests.  The bear market has achieved its goal - to clear sentiment on a longer timeframes and lay the foundation for a real change in trend.  The view of Gold and its sentiment on longer timeframes is a picture perfect example of the ebb & flow of Cycles. The $40 "recognition day" last week was obviously more than enough confirmation to declare a new Daily Cycle (Daily Cycle is 24-28 trading days), but it was powerful enough for declaration of a new Investor Cycle (Investor Cycle is 22-26 Weeks) as well.  This is the development we’ve patiently waited for.  However, on shorter time frames, Gold has pushed the Daily Cycle into an extremely overbought state, so a $20 or more retracement is possible. This is only a problem for short term traders; a decision to take a new position now at such overbought levels could mean entering just as the market cools off.  Nobody ever said that trading is easy, and determining when to enter a fast-moving asset is a frequent dilemma.  Getting the trend right is only part of the challenge.  Gold's 1st Daily Cycle typically rallies until day 18-20 before topping, so on day 13 here we’re likely to see another push higher before Gold turns down into its 1st Cycle Low.  There is no way of knowing how powerful the remainder of the Cycle will be, but the average 1st Daily Cycle adds 10%.  If that happens this time, Gold will top at around $1,364.   6-20 Gold Daily Read More

Don’t Let Gold Lock You Out

Although I had become far more optimistic recently and my stance of late had rapidly shifted towards the bullish side, I certainly wasn’t expecting a $40 surge at this point in the Cycle.  But that’s gold for you, easily capable of leaving traders behind while making extreme moves.  What I like most about this move is that it was not reactionary, it did not respond to a fleeting sound bite.  It also did not come from an oversold position where you would expect a natural counter trend bounce.  What I had warned members about last night was that gold was looking stronger, and that a move above $1,285 would be completely out of character for a final (falling) Daily Cycle.  Therefore, any move above $1,285, especially on a closing basis, almost certainly would have meant that gold had already begun a new Investor (Weekly timeframe) Cycle.


Gold rocket


What we have here is a good old honest “recognition day”, as traders suddenly realized that they needed to be on the other side of this trade.  For Cycle’s followers, this more than confirms, no it essentially guarantees, that we’re now in a new Investor Cycle with potentially 12-14 weeks of upside ahead!  But more importantly, it brings us that much closer to confirming my call for an end to the gold bear market back in 2013.  If my longer term expectation holds, then a resumption of the gold secular bull market is already underway.

If anyone does not have any exposure to this sector or has found it difficult to buy into this surge, don’t be disheartened.  As I’ve expected since the December lows, this is now likely that successful retest of the 2013 bear market lows and a resumption of the bull market is now underway.  There will be plenty of opportunity to capitalize; gold still has a 45% move to eventually match all-time highs, while most precious metals miners are still 75% off their highs.

A Faithless Rally

Another week has gone by with yet another all-time high.  There has been no material change in either the long term outlook for equities or in FED policy, so one can be forgiven for being dumbfounded by the relentless march higher.

However, as I’ve said often during the past 12 months, the current move cannot be quantified. This is the tail-end of one of the strongest bull markets in history, and the forces at play are far too powerful and extreme to be rationalized with traditional metrics.  The current move entered into a runaway phase long ago, and the final speculative blow-off is driving non-believers absolutely insane.

By non-believers, I refer to those who fail to understand that markets are often irrational.  And that during the end of large cyclical moves, assets can be divorced from underlying fundamentals and can even behave in ways that almost seem counter to them.  These extreme moves are self-fulfilling and relentless, and can cause even rational observers to raise the question of whether this time may be different.  As humans, we quickly forget that all things in life, and especially in financial markets, move in distinct Cycles.  How else is it possible to explain the FED missing some of the largest financial storms in history?

The current Daily Cycle has now matched my more optimistic forecast, set when the current DC began.  And now, deep in the Daily Cycle (day 38) and very much overbought, equities should find it difficult to continue higher without some sort of short term consolidation.  When I review the Daily Cycles from this past 2.5 year bull run, I can find only one other instance (41 days) where new highs were set this deep into a Cycle.

On Friday, the S&P closed above the Bollinger Band on day 38 while registering as extremely overbought.  Although we can never rule out a few additional sessions higher, it is now likely that a turn down from the current top will ensue, bringing a rapid decline back to the 1,890 area.  Because the current DC is already into the timing band for a DCL and the current move is speculative in nature, we should watch for heightened volatility and a sharp move lower during the next 5-7 sessions.


6-7 SPX Daily

The DC path appears clear, but it is trickier to determine exactly what the Investor Cycle has ahead.  Because the Yearly Cycle has gone parabolic and the markets are clearly irrational, the very idea of trying to pinpoint a specific outcome seems ludicrous.

But what we do know is this: because the current DC is so deep and overbought, the next move is likely to be lower.  The strength and Extreme Right Translated nature of the current DC point to a shallow DCL, with the likelihood that the next DC exceeds the current high.  The next Daily Cycle (likely the top of the current Yearly Cycle) will probably make an attempt at bettering the 2,000 level.  I know this sounds far-fetched, but it also sounded that way when I proposed prices over 1,800 and then 1,900 many months ago.  The current bull market should not be underestimated.


6-7 SPX Weekly

The Financial Tap publishes two member reports per week, a weekly premium report and a midweek market update report.  The reports cover the movements and trading opportunities of the Gold, S&P, Oil, $USD, and US Bond Cycles.  Along with these reports, members enjoy access to two different portfolios and trade alerts.  Both portfolios trade on varying timeframes (from days, weeks, to months), there is a portfolio to suit all member preferences.

  You’re just 1 minute away from profitable trades! please visit https://thefinancialtap.com/landing/try# 

Laying Out The Traps

Two week ago I first called for patience regarding Gold’s expected Investor Cycle (Investor Cycles run 24 weeks) decline.  Since then, Gold has continued to chop sideways in a largely lifeless and apathetic manner.  The few price spikes we've seen have typically come during thinly traded markets, with little follow-through and prices that close near where they opened.    

The current price action is why the Bollinger Bands have constricted so tightly.  The trading range has narrowed with each passing day, and volatility is now at an extreme low.  The lack of volatility is reflected in the 2nd tightest set of Bollinger Bands since the start of the bull market 14 years ago.  Regular readers will know that I place significant predictive value on instances where tight Bollinger Bands occur near expected Cycle pivots. 

My current Gold analysis is beginning to sound repetitive, so I hope my call for patience will continue to be heard.  The facts have not changed – Gold is in the timing band for a Daily Cycle Low (DCL), but has yet to complete a recognizable Cycle Low.  Because moves out of tight Bollinger Bands are almost always fast and extreme, I expect that to happen this time as well.  And the evidence continues to support the idea that the coming move will be sharply lower into a DCL.

5-24 gold daily

Even though we’re expecting a sharp decline, such a drop could be good news for Gold bulls.  If the coming Daily Cycle Low holds above $1,179, it should be an extremely bullish event.  Cycle Lows serve as important, sentiment clearing events, and are necessary if a sustained move higher is to follow.  In addition, with Gold on week 21 of an Investor Cycle (which normally runs between 22-26 weeks), we could well be looking at an Investor Cycle Low at the same time, one which could also mark a significant turning point in Gold’s longer term outlook.

My goal has always been to assess asset price behavior in as unbiased a way as possible, focusing on the most probabilistic Cycle outcomes.  But like any technical discipline, Cycles are not absolute; there is room for interpretation, and an allowance for alternative scenarios must be made.  I don’t look to sensationalize my analyses, and they should not (and cannot) be presented in terms designed to give the illusion that they are foolproof.  Cycle analysis is all about determining the most probable outcomes.

With Gold’s current setup, we’ve finally reached a significant Cycle pivot…and I believe that we are likely to be treated to a very surprising turn of events.  Directly ahead is, I believe, a major turn and rally for Gold.  I can’t be certain of the exact timing, since there exists the possibility of another Daily Cycle (in the current Investor Cycle) which could stretch into late June, but I need to reiterate my belief that Gold’s bear market ended last year, in June.  To confirm that Gold's bear market is over, the coming Investor Cycle Low (ICL) will need to hold above the prior two ICLs ($1,179).  If this plays out, the coming decline from tight Bollinger Bands should see the bears pile in on the short side, driving Gold's price toward the level of the last ICL.  At some point, price should reverse sharply, trapping the bears and punishing them with a rally fueled by Short covering.

5-24 Gold weeklyIn August of last year, my call of an end to Gold's bear market was based both on anecdotal evidence and my experience reading the tape.  But it wasn't until the successful retest of the low in December that Cycles truly supported the idea that a bottom was in.  And now, with the approach of the 2nd ICL since the June 2013 bottom, Gold appears to have formed a wide and bullish foundation upon which the next bull market will be built.  

The last Yearly Cycle Low occurred in June of 2013, making the coming YCL very important in confirming the end of the bear market.  I expect that Gold will hold above $1,179, giving us both a 2nd straight Investor Cycle above the June 2013 Low and, more importantly, a successful retest of the last June's Yearly Cycle Low.  If the retest is successful, Gold will have completed a very bullish inverse monthly H&S pattern, and a sharp counter-trend rally will be almost assured.  Gold's moves out of Yearly Cycle Lows are often explosive, and there is no reason to expect that this time would be different.  A new rally should be intense, and my expectation is for a move back to prior resistance around $1,520.    

5-24 tgold monthly

The Financial Tap publishes two member reports per week, a weekly premium report and a midweek market update report.  The reports cover the movements and trading opportunities of the Gold, S&P, Oil, $USD, and US Bond Cycles.  Along with these reports, members enjoy access to two different portfolios and trade alerts.  As these portfolios trade on varying timeframes (from days to months), there is a portfolio to suit all member preferences.

LIMITED TIME PROMOTION.  You're just 1 minute away from profitable trades! please visit https://thefinancialtap.com/landing/try# AND ENTER PROMO CODE: 29off     This will reduce ANY product by $29 (including the annual).