Gold on the Ledge
Gold on the Ledge
Cycle Counts
| Cycle | Count | Observation |
Cycle Trend |
Cycle Clarity |
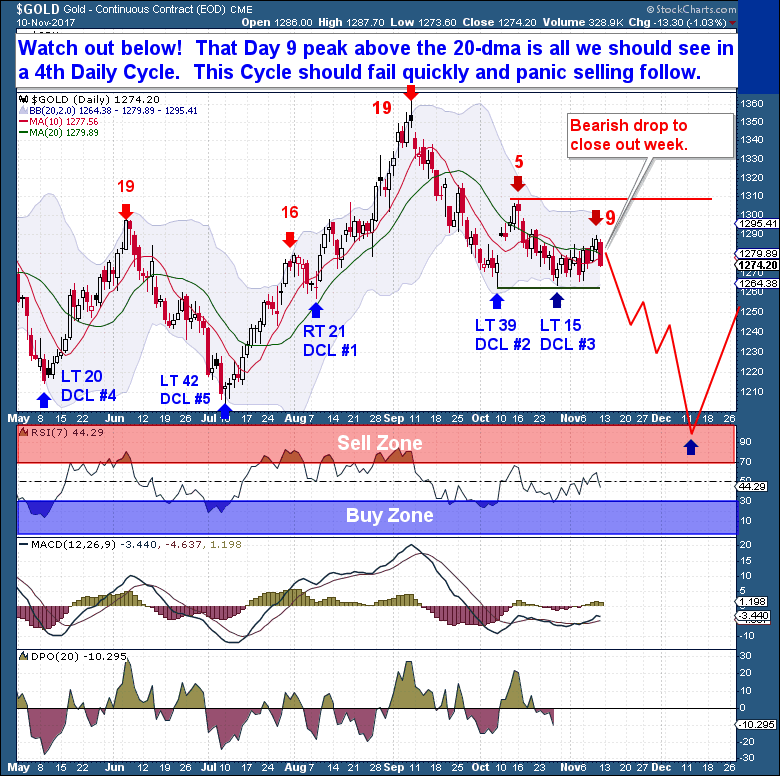
| Daily | Day 11 | Range 24-28 Days – 4th Daily Cycle | Topped | GREEN |
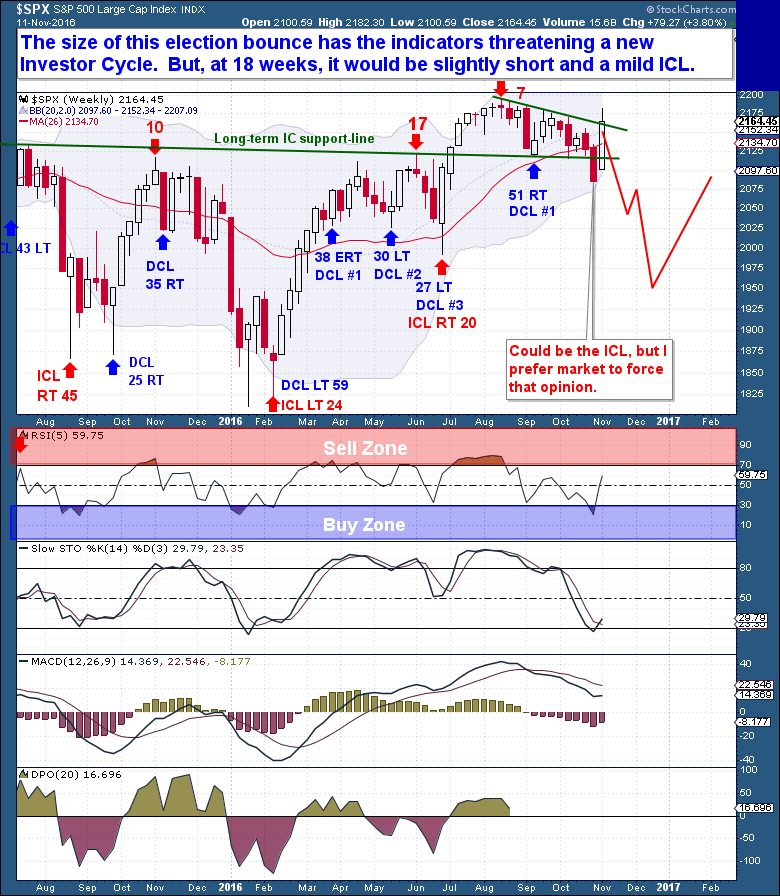
| Investor | Week 18 | Range 22-26 Weeks | Topped |
GREEN |
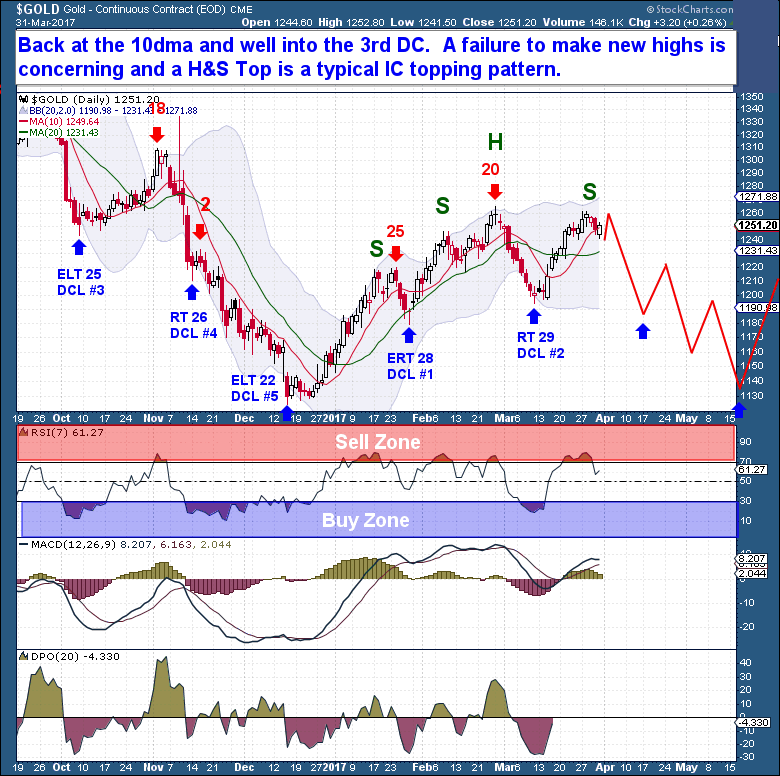
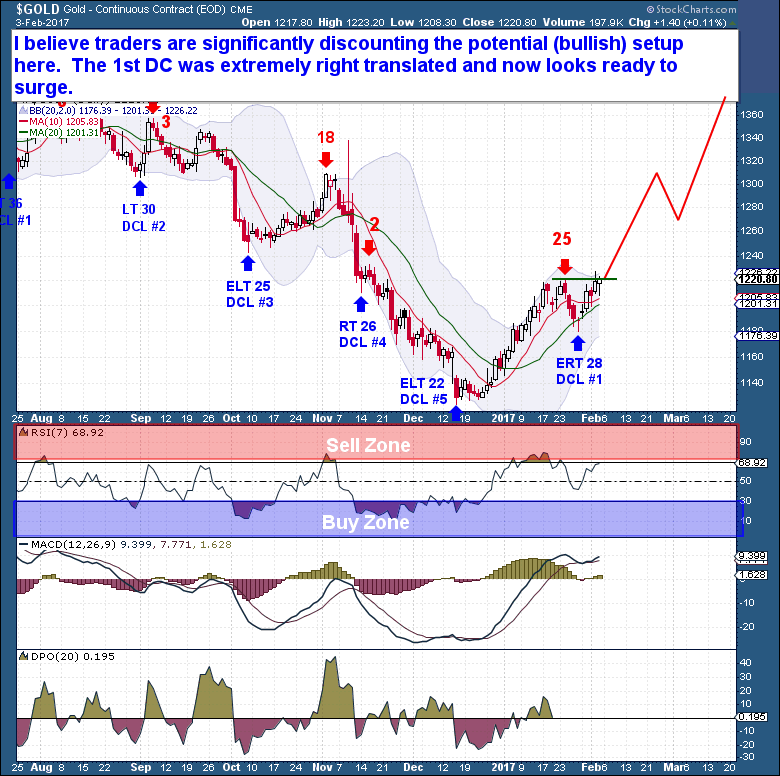
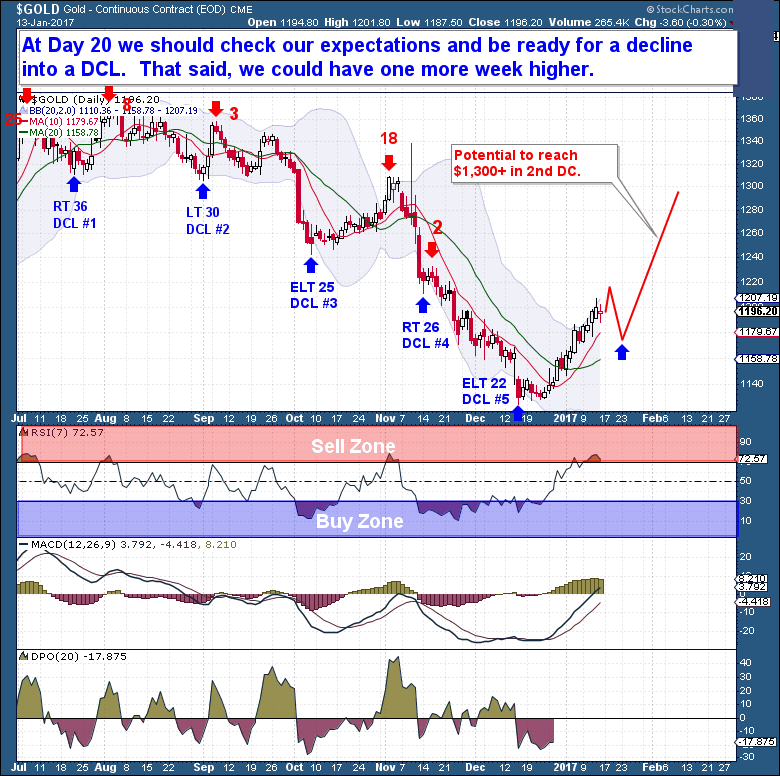
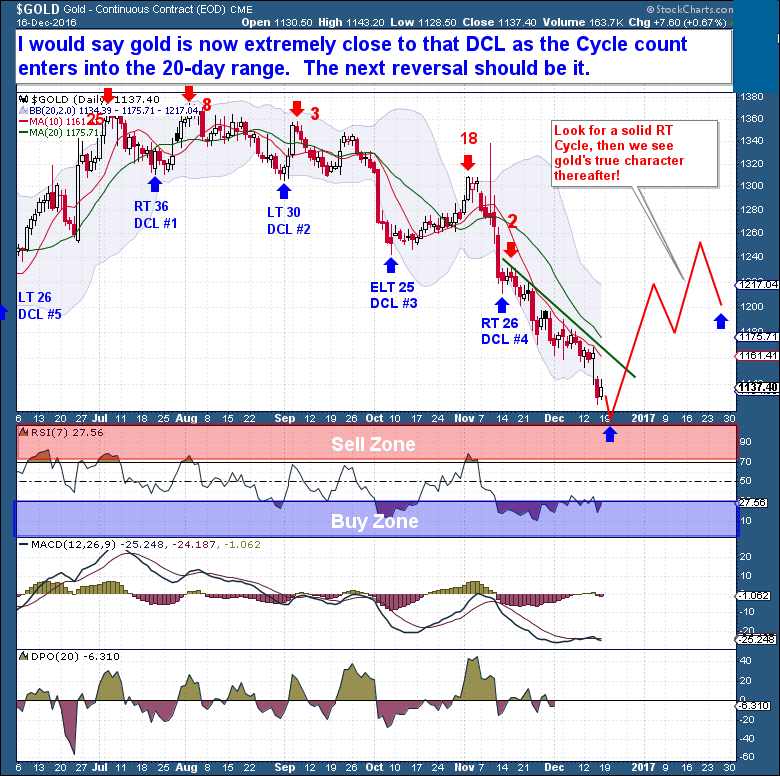
This is my favorite time within any Cycle. Mostly because it’s one of three points within an Investor Cycle where the probability of getting it right is as favorable as it will ever be. If played correctly, it’s also the type of setup where your portfolio can be given a significant boost. In this case, I am of course talking about the final Daily Cycle top, where the move down into the Daily and Investor Cycle Lows is often the most powerful and convincing of events.
Of course, my usual disclaimer is provided here (mostly for any new members). There are no guarantees to any technical study/discipline. And although your confidence level in any given setup may be high, it’s still a fine balance between being aggressive and defensive. On the chart below, I highlight the Day 5 peak in October, near $1,308, where if gold were to exceed any bearish interpretation must be abandoned.
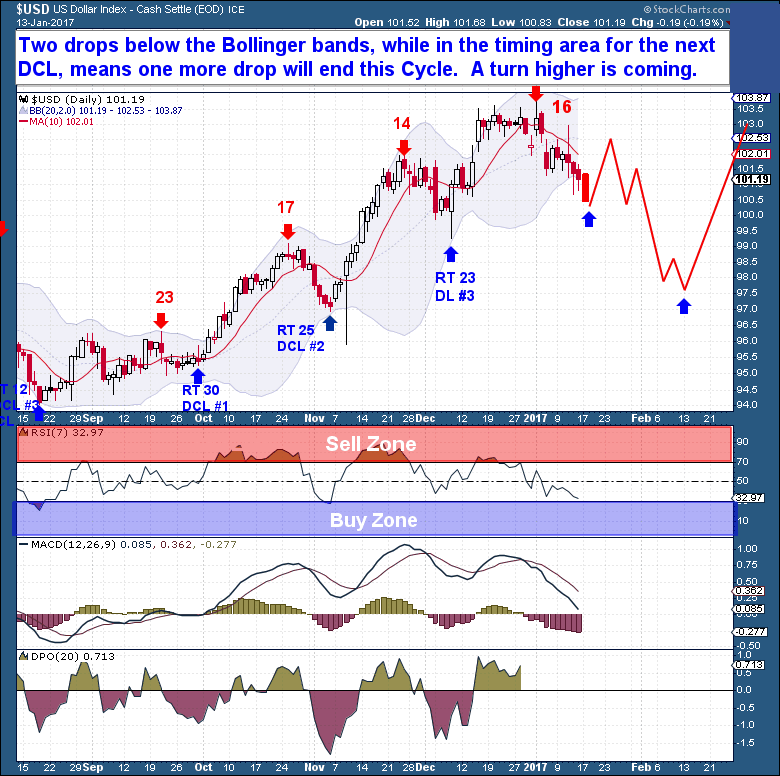
But I doubt we get anywhere near. So for the current Daily Cycle, all I can say is watch out below! What I see here is a final Daily Cycle peak occurring on Day 9, right above the 20-dma. From a timing perspective this is as perfect and as you would expect for a final Daily Cycle. From a Cycle’s Setup standpoint, the chart below shows a very well constructed Investor Cycle starting in July with two Daily Cycles up and now what will end up becoming three Daily Cycle down. It should end as a perfect 6-month Investor Cycle trough to trough. From the way the market sold off last Friday leads me believe that the top for this Daily Cycle is already in. And the $USD is also consolidating lower into it’s own Cycle Low, meaning that once it begins its new rally this week it with further add pressure to gold.
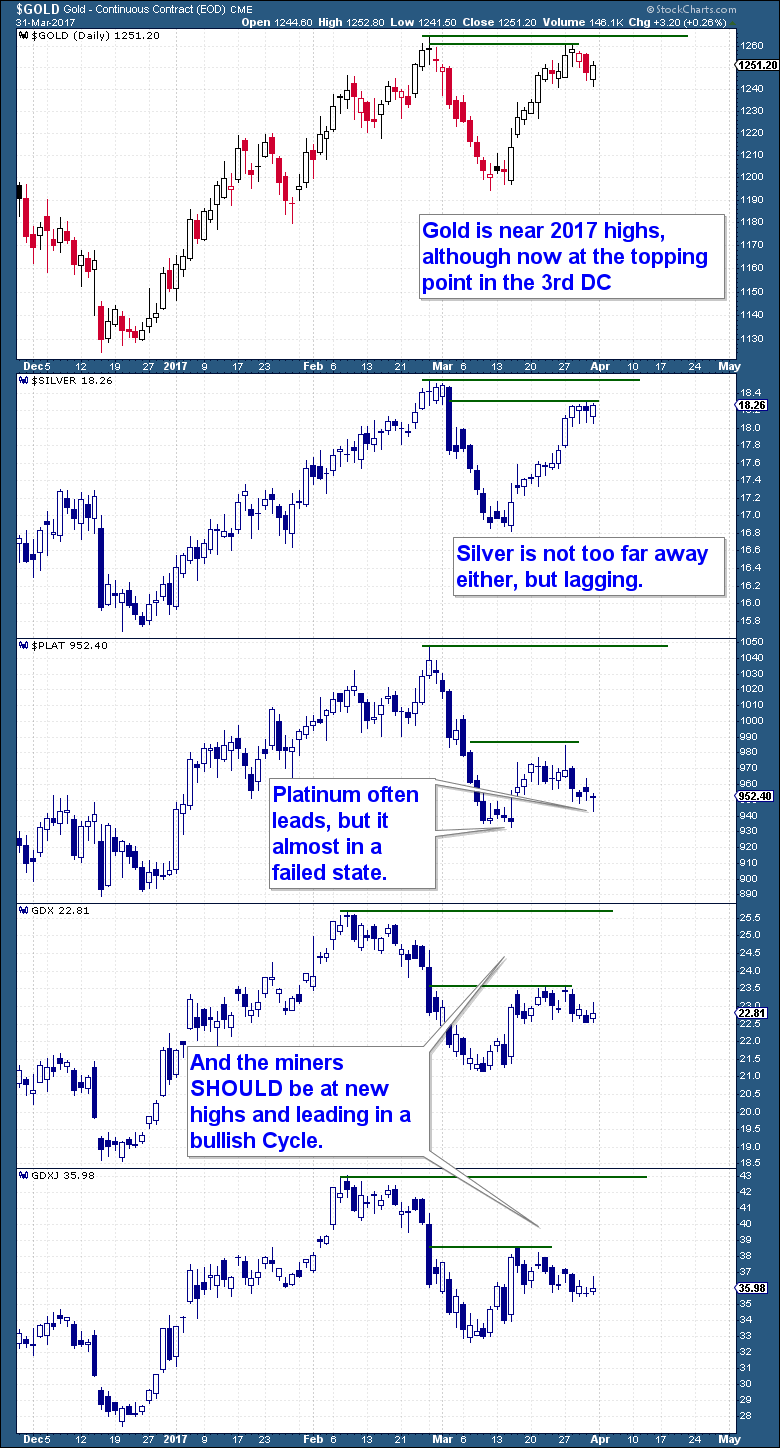
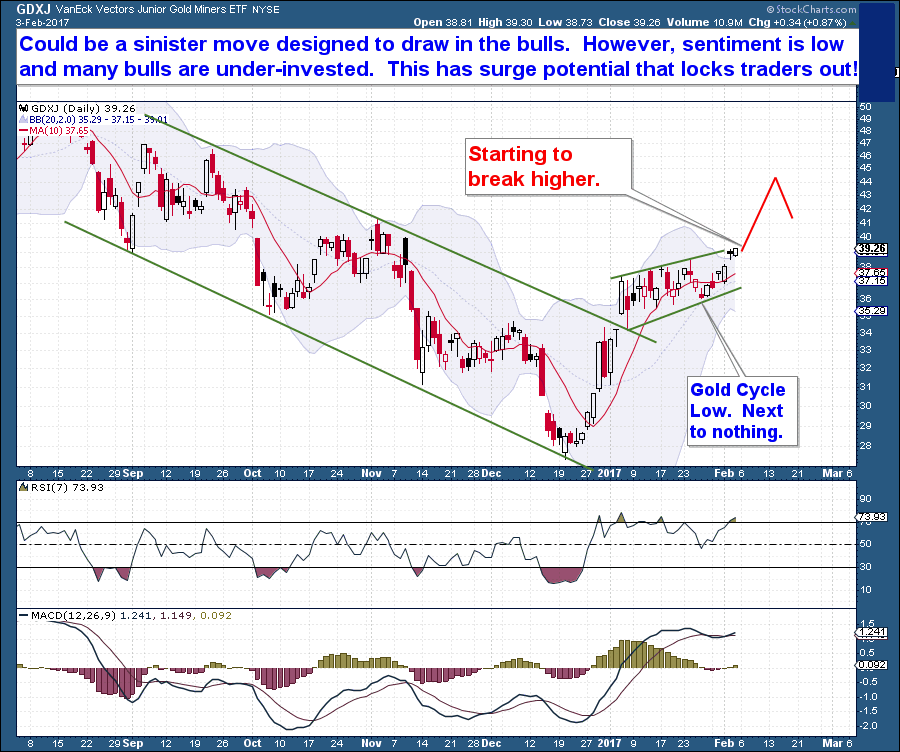
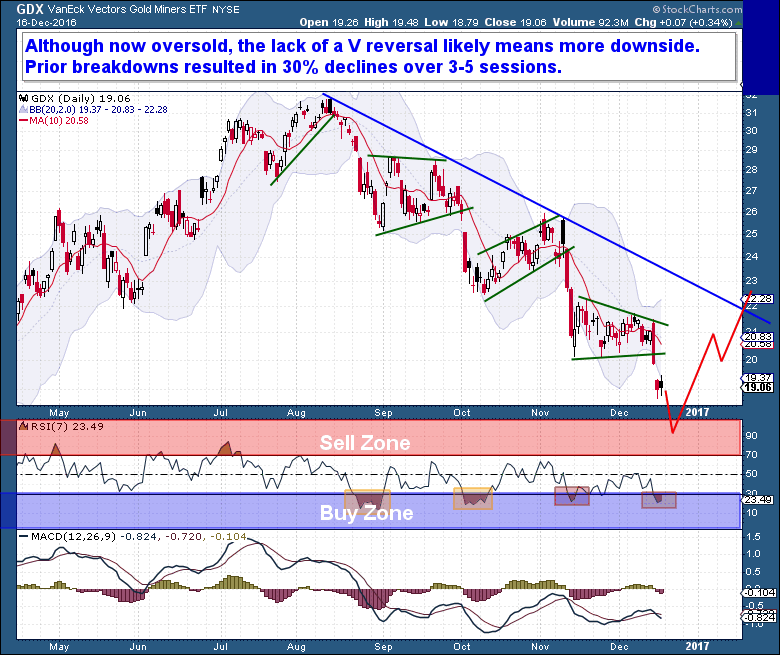
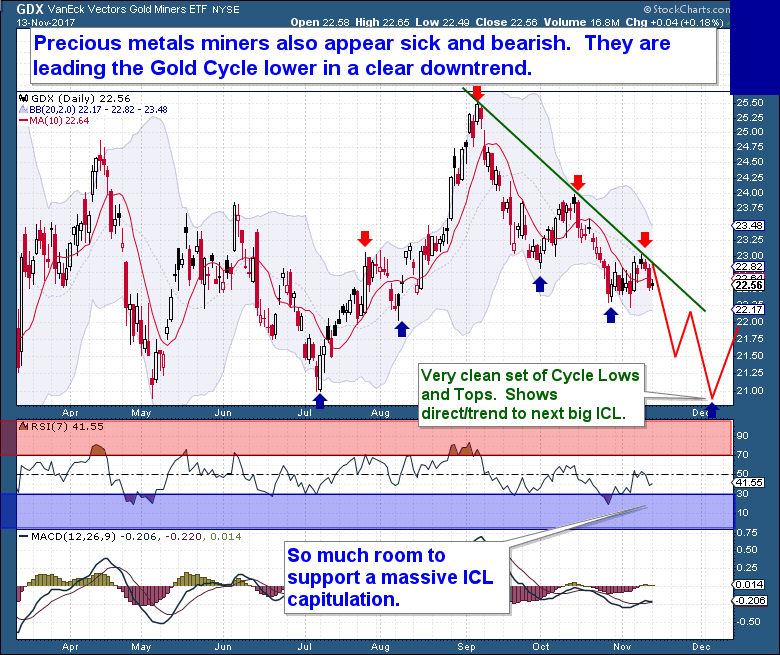
Providing more confidence that a big Investor Cycle Low is ahead in the December time-frame is by looking at the precious metal miners performance. I mean just one look at the chart below clearly illustrates how underwhelming they have been and how bearish the chart looks.
Remember that miners are almost always a leading indicator for the gold cycle and they’re currently locked in a sustained downtrend. Sadly too, the chart technically has plenty of room to support another major selloff before ending in capitulation.
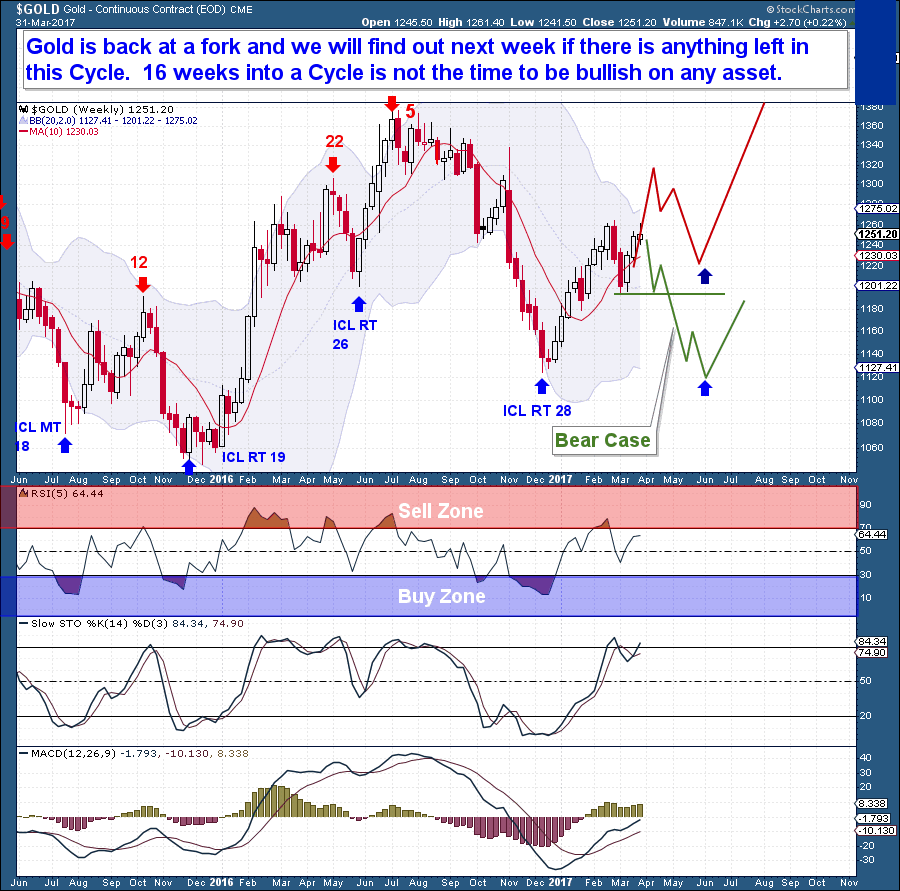
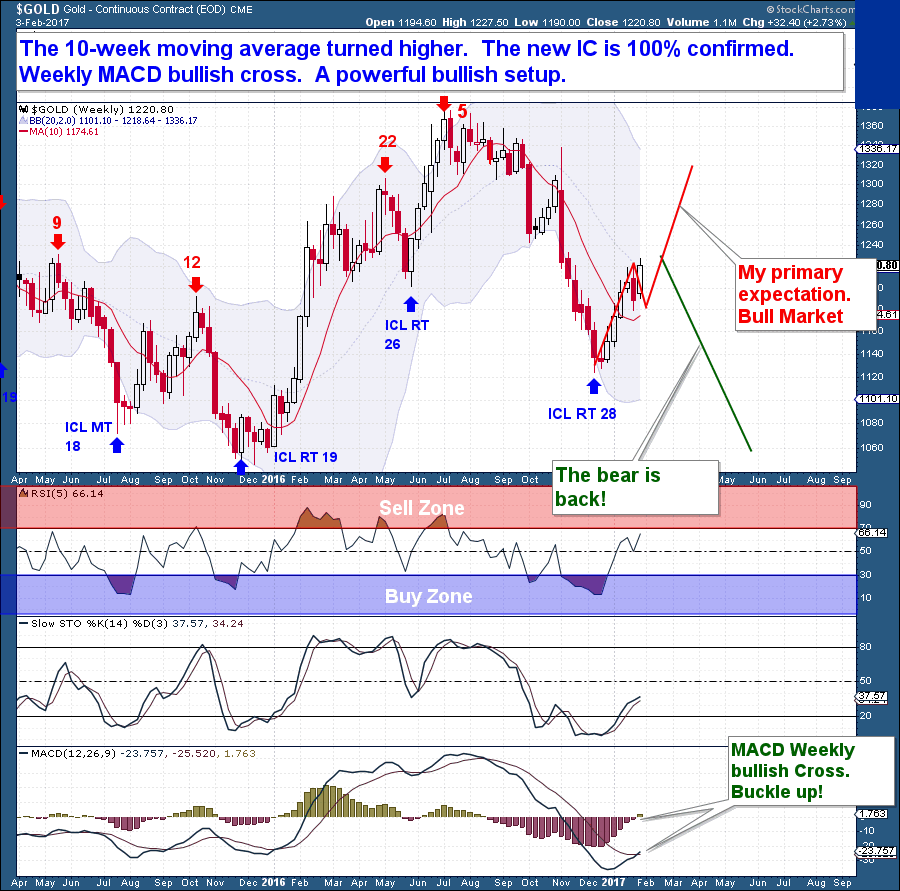
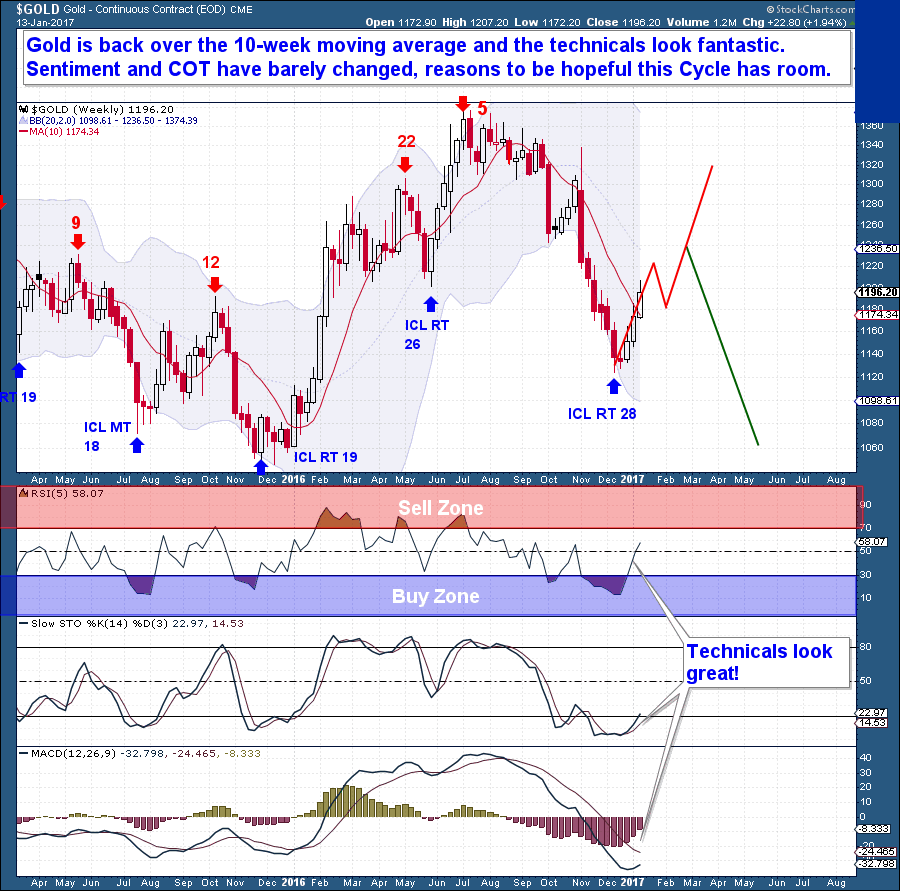
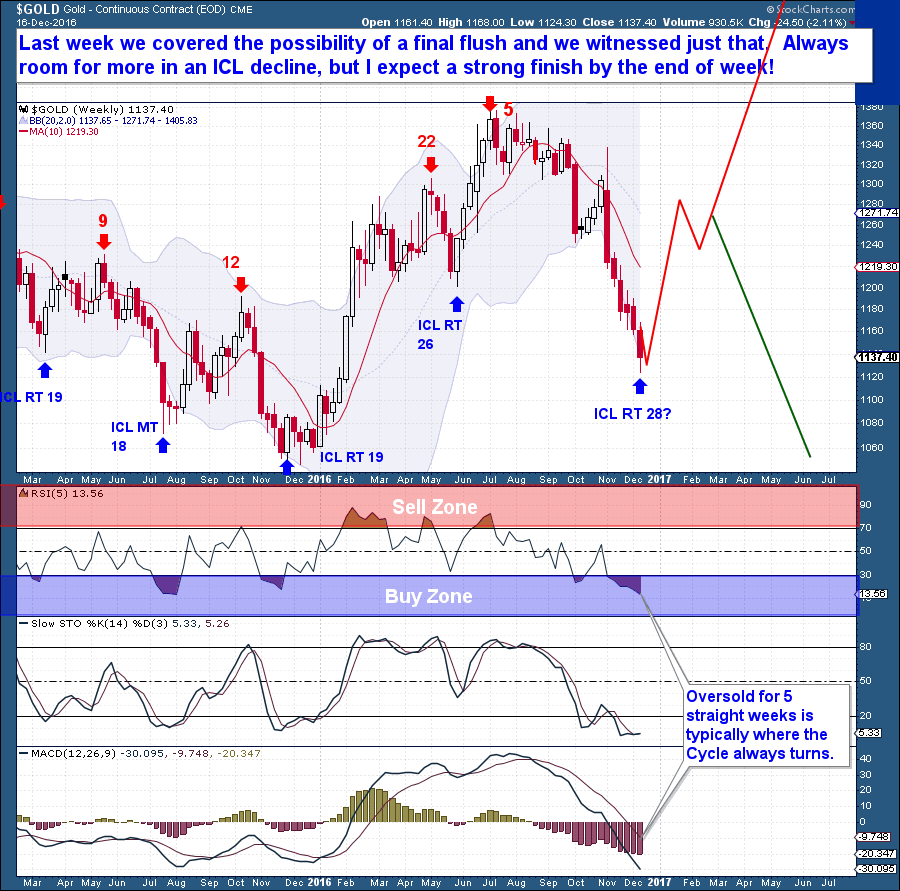
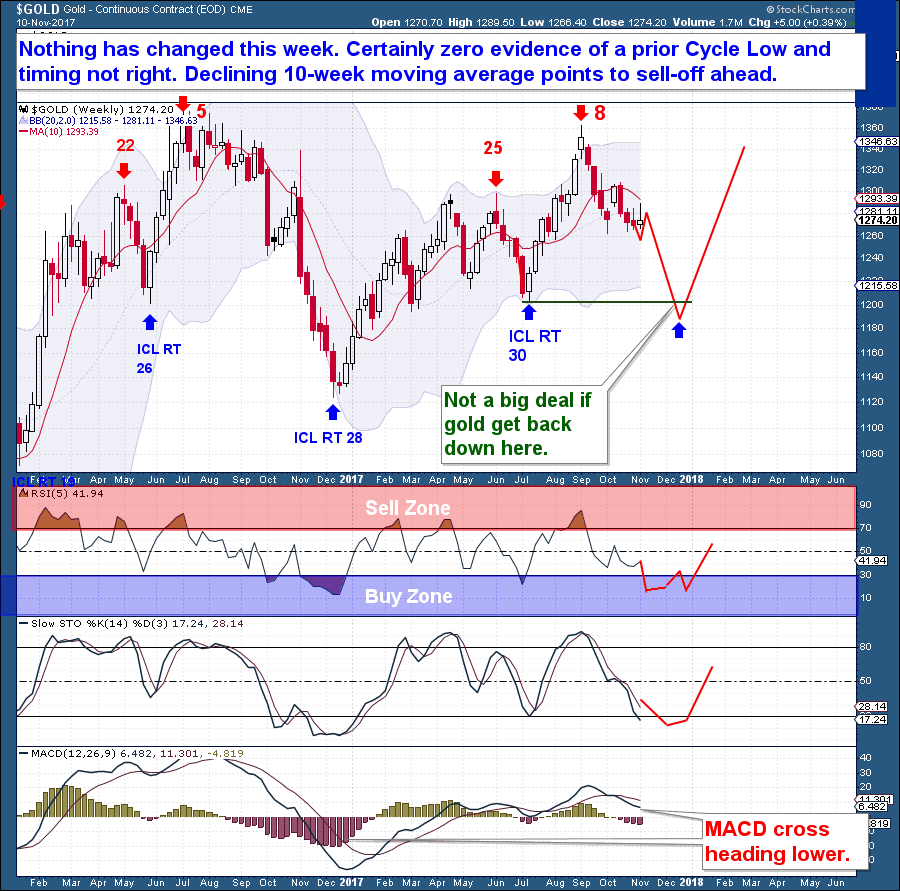
What the bears should focus on is that we certainly have zero evidence of a prior Cycle Low. Gold’s weekly Cycle Lows are always very clear events on the chart, which is obvious to me why we have the final capitulation phase of the Cycle still ahead of us. With now a declining 10-week moving average and a fourth Daily Cycle right in position to turn lower, I’m afraid a major sell-off will be difficult to avoid here.
Could I be wrong? Absolutely, I’m not a stubborn analyst, I merely trade with my knowledge of Cycles and the probability they afford. If I’m wrong, then gold will move higher above $1,308 and traders should immediately flip bullish, as it would indicate a major change in market character. But honestly, all the history suggests that gold is about to see a $100 fall. However, it would not be the end of the world for gold, but just another trough in the ebb and flow world of Cycles. In fact, I look forward to that Cycle Low, as I will be trading it Long aggressively and also plan to add significantly to my store of gold bullion.
Trading Strategy
If the market did top on Friday, then the potential downside in gold is such that the type of gains could offer up really massive gain in the portfolio. It’s the type of high confidence Cycle trade I prefer because it offers an attractive asymmetrical trade, meaning that the risk is fairly well defined and managed, but the potential gains from this type of setup are in the magnitude of 6x or more the risk.
I’ve already entered into some aggressive short Gold and Precious Metals Miners positions. My risk to capital on each trade is less than 1% because I am using the $1,308 level on gold and the $23.02 level on GDX as my stopping point.
One important aspect of such trades is to always remain patient and allow the trade to unfold. You always want to ignore the intra-day market gyrations and stick to the plan. This type of trade will either stop out for a small loss or you want to keep an eye on an early December Cycle Low, nothing before that. As always though, we should accept what the market gives…or does not. If the analysis ends up being incorrect, despite the heightened level of confidence, then that is OK too because the trade setup has planned (although do not expect) for that possibility. Planning for both outcomes affords you the luxury of not having to get emotional on a trade or the need to babysit it.
The Financial Tap – Premium
The Financial Tap publishes a weekly premium member reports. The report cover the movements and trading opportunities of the Gold, S&P, Oil, and $USD, Cycles. Along with these reports, members enjoy access to a real-time portfolio with trade alerts, and constant education on trade and risk management. Although an important aspect, the service is not only about trade signals. I want to help traders and investors become better and to learn from experience in a way that will help them develop their own unique strategy/system.
Performance
The Financial Tap is primarily geared towards helping traders and Investors become better. We walk you through the process of Trade Setup and identification through the study of market Cycles. There is an extreme emphasis placed on Risk Management and on preserving capital.
The Financial Tap portfolio is current;y up 41.1% for the prior 12-months and for the calendar year is up 37%. In the 10 months of 2017 trading the portfolio has taken 42 trades, for an average of 4.2 trades per month. As you can see, this is not geared towards day or very active traders. The portfolio is very patient and deliberate with trade identification and selection. Of the 42 trades, 34 were winners and 8 were losers, a ratio that is above the 60% average win rate for the portfolio. All trades are posted in real-time and timestamped.
The portfolio is also a low risk strategy, with aggressive risk management and almost never risking close to 1% of capital on any given trade. Winners are given the chance to run and losers are cut quickly. During the past 12 months no options or margin was ever used, and the portfolio sat with more than 50% cash for a significant portion of the time. Obviously, these are uncommon results even by our own standards and are not necessarily predictive of future performance.
For more information and membership options – Please click the join now button.