Gold Just Needs More Time

The Gold market appears to be in reverse gear at present. It’s at fresh 6 week lows with a 2nd Daily Cycle that continues to wind lower, and is showing nothing that’s at all positive. Gold is trading very lethargically, and is uninteresting from most perspectives.

Assets move higher or lower in direct relation to the sentiment of traders and investors. And sentiment swings like a pendulum, from bullish to bearish and then back again. Sentiment is the primary driver of demand, with greater buyer engagement – both in numbers and enthusiasm – required to drive prices higher. Unfortunately for Gold bulls, it appears that the sentiment pendulum has already peaked, and is heading back toward bearish lows. We see this clearly in the COT reports, with traders continuing to shift from net Long to net Short positions. The report’s actual survey data confirms that sentiment for the current Investor Cycle has topped, and is now in decline.

Ultimately, price action rules. In this case, with the current Daily Cycle having declined for 22 days (and counting), Gold’s price shows clear confirmation of an Investor Cycle decline. Bullish Cycles generally contain declines of no more than 10 days.

Headlines don’t always drive asset prices, but if Gold were inclined to move higher, last week’s sound bites around both a potential Greek exit and a breakdown of the Ukraine ceasefire offered plenty of fuel for it. Instead, Gold continued moving lower without a hint of strength. Given the geopolitical backdrop, Gold’s lack of upside movement speaks volumes about its underlying demand.

Gold Daily Cycle

On the Investor Cycle timeframe, the current 4 week decline also creates problems for bulls. There is no way to sugar coat it: the action has been downright bearish. In my opinion the evidence clearly shows that the current Investor Cycle has topped and is on the way to a Investor Cycle Low.

From a review of past Cycles, especially those of the past 4 years, it’s clear that the week 11 high is almost certainly the top of the current Investor Cycle. Having price fall through the weekly trend-line is one issue, but the firm close below the 10 week moving average creates even more of a concern. In addition, an Investor Cycle in an uptrend rarely sees price spend an entire week below the 10 wma, but that’s what happened to Gold this week.

2-21 Gold Weekly

With Gold now 15 weeks into the current Investor Cycle and with a 10 wma that has turned lower, it’s clear that the current Investor Cycle is in decline and on its way to a trough. At this point, the evidence is conclusive, so only an outlying Cycle development would shift our outlook.  Traders need to be aware that an oversold Daily Cycle rally should come this week, but that is an opportunity to sell on strength and capture the larger move lower over the coming months.

The Financial Tap publishes two member reports per week, a weekly premium report and a midweek market update report. The reports cover the movements and trading opportunities of the Gold, S&P, Oil, $USD, US Bond’s, and Natural Gas Cycles. Along with these reports, members enjoy access to two different portfolios and trade alerts. Both portfolios trade on varying time-frames (from days, weeks, to months), there is a portfolio to suit all member preferences.

You’re just 1 minute away from profitable trades! please visit: https://thefinancialtap.com

Feel free to share this post via the below social media avenues.

Cycle Chart Setup – Bonds

Up until last Friday, the decline shown in the bond market was anticipated because the next logical Cycle Low was due. The ebb & flow nature of the bond Cycles are very visible, clear, and well defined on the chart below. And in a bull market trend, this type of pattern makes it relatively easy for us to predict both the top and low of each Cycle.

But the bond market sell-off has intensified this week, to the point where the expected Daily Cycle Low should have been comfortably behind us by now. The extent of this sell-off is approaching levels normally reserved and experienced during the deeper Investor Cycle Low, and each of those past Investor Cycle Low’s have led to some pretty substantial gains.

I doubt that’s what is occurring here, I still favor a standard Daily Cycle Low here that is likely to produce at least a powerful counter-trend rally. I say counter trend because the worst case scenario is that this coming Daily Cycle rally forms a double top before turning lower towards a true Investor Cycle Low.  Regardless, a rally is forthcoming and we know  in any bull market uptrend, the dips should be bought.


Feb 12th Bond market DCL

The Financial Tap publishes two member reports per week, a weekly premium report and a midweek market update report. The reports cover the movements and trading opportunities of the Gold, S&P, Oil, $USD, US Bond’s, and Natural Gas Cycles. Along with these reports, members enjoy access to two different portfolios and trade alerts. Both portfolios trade on varying time-frames (from days, weeks, to months), there is a portfolio to suit all member preferences.

You’re just 1 minute away from profitable trades! please visit: https://thefinancialtap.com

Feel free to share this post via the below social media avenues.

Crude’s Capitulation Phase

(Note: Our once only annual membership sale details at end of post)

After a long and relentless decline, the Crude market has finally enabled us to anchor its Cycles. Up until 2 weeks ago, Crude was locked in a clear crash Cycle, which made it impossible to expect anything other than a continuation of the crash. But now that Crude has reversed with a 20% rally, its moves are clearly the start of a new intermediate term Cycle.

Based on the duration and the extreme nature of the recent Investor Cycle (IC) decline, Crude’s new-found strength is almost certainly the start of a new Investor Cycle. It’s impossible to know whether the current up-move will be only a counter-trend bounce, but because this is the 1st Daily Cycle of a new Investor Cycle, we should expect the current Cycle to be Right Translated (Meaning it will top beyond the midpoint of the Cycle).

2-9 Crude Daily

On a longer time-frame though, I’m not convinced that the current 8 month downtrend has marked the bottom for Crude. The crash was supply-driven, and the underlying issue will take time to resolve. The genesis of the crash was excess investment in Crude production, which resulted in a supply glut that can only be solved through lower prices, over an extended period of time. Although the move down has been extreme, it’s a completely natural reaction to a significant supply/demand imbalance.

Three months of prices below production costs is not nearly enough time to have soaked up the current glut of supply. Oil firms have invested heavily in their production facilities, and want to be certain that the demand/supply dynamic is going to persist before shutting off production. And taking production offline is not immediate. It’s a lengthy process, with the decision to remove production leading market impacts by a significant length of time.

As with any bull market, Crude faces a situation where only time and repeated losses will cause participants to accept the market’s new reality. Any decision to close a facility is based primarily on expectations for longer term prices, and price expectations are always intensely biased to the upside at the end of a bull market. If Crude shows even a hint of a quick recovery in price, firms will be encouraged to “weather the storm”, only prolonging the extent and length of the decline.

So long as the massive stockpile of Crude inventory persists, lower production will not – in the short term – correct the imbalance. What’s required will be for facilities to close, production to fall, and enough time to pass for the existing inventory to be worked down. Unfortunately, I believe that the imbalance is structural, so it cannot and will not be corrected quickly on the demand side. Until we see supply better reflect the true demand for Crude, there is little prospect of a longer term recovery in price.

Courtesy Bedspokeinvest

Bankruptcies and closures of Oil companies are underway, and this will help to reduce the supply imbalance. But this process will need much more time, possibly years, to play out. A look at the number of rigs in production makes it clear what led to the crash in prices. Between 2010 and 2014, there was massive over-investment in production, resulting in the addition of 4 million barrels of US Crude production per day. The result was the highest level of production in 30 years.

The current drop in rig counts has, so far, been about 30% from peak to trough. In past crashes, however, the rig count has declined by 50-60%. It takes time for any supply imbalance to work its way through the system because producers find it hard to shut down production. In some cases, producers even ramp up production in an attempt to compensate for the price declines. Netting it out, even with the recent price crash and rig closures, Energy Administration numbers show that the US still produces 9.19 million barrels of Crude per day, the most since 1983.

2-9 US Oil Rig Count

Given current production, any upside movement in Crude prices will likely be capped. During the past 5 years, Crude witnessed a huge boom and period of over-investment, and it will take longer than 7 months to correct the imbalance. I believe that the best the industry can hope for is that price recovers to the $60 to $70 level, where production is closer to its break-even point. That said, markets rarely work logically, and are typically drawn to the levels that will inflict the greatest pain on the most people in the shortest length of time.

It has been a minimum of 37 weeks since the last Investor Cycle Low. This is one reason why back-to-back powerful weeks, the first such sequence since last May, signal the start of a new Investor Cycle. But with Crude coming out of a crash Cycle, price discovery will be difficult, and we should continue to see heightened volatility. To solve the over-production issue, I believe we’re going to need at least a year of depressed prices. If so, during the next 2 Investor Cycles (52 weeks), Crude prices should fluctuate between $40 and $60, with a real possibility of a drop below recent lows.

2-9 Crude weekly


The Financial Tap publishes two member reports per week, a weekly premium report and a midweek market update report. The reports cover the movements and trading opportunities of the Gold, S&P, Oil, $USD, US Bond’s, and Natural Gas Cycles. Along with these reports, members enjoy access to two different portfolios and trade alerts. Both portfolios trade on varying time-frames (from days, weeks, to months), there is a portfolio to suit all member preferences.

Precarious Times for Equity Markets

It suddenly seems as though the good times in equities might be ending. Though my perspective is based only on “gut feel”, there seems to be an underlying level of fear that has crept into the markets. If so, it’s a real problem for equities. Any market trading at all-time highs and with a valuation far above historical averages requires a continued level of irrational excitement and speculative ignorance to remain sustainable. And fear is not consistent with irrational, speculative ignorance.

When equities price in Risk, it can happen quickly, and I believe the markets are in the early stages of doing just that. Though equities don’t want to believe that significant downside is possible, crashes in commodity prices and massive demand for high quality debt are harbingers of significant declines ahead. In my opinion, the early stages of an equity market decline are unfolding, and it’s only a matter of time before it erupts into a serious event.

Macroeconomic measures don’t always correlate directly with equity market performance, at least not in the immediate term. But when economic numbers begin to look as ugly as they are at present, I can assure you that an overheated and extended market will stand up and take notice.   Of particular note this week are several ominous signs:

  • Earning season is off to a slow start; big names are missing earnings expectations, and forward guidance is at the lowest level since 2007.
  • US Q4 real GDP came in at 2.6% annualized vs 3% expected.
  • Durable goods fell 3.4% month-over-month, far below expectations.
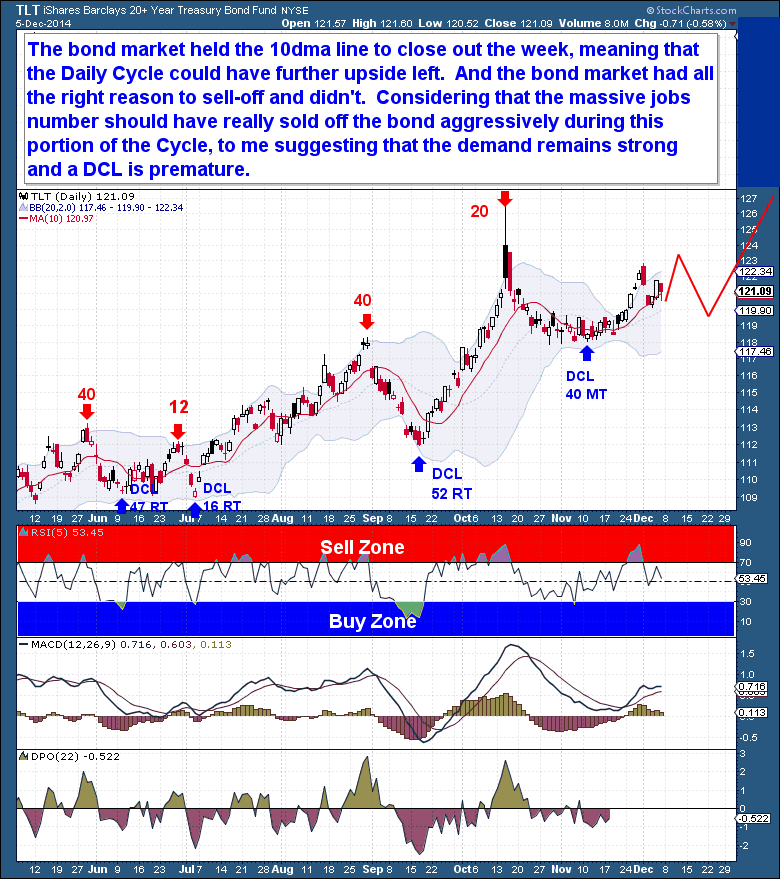
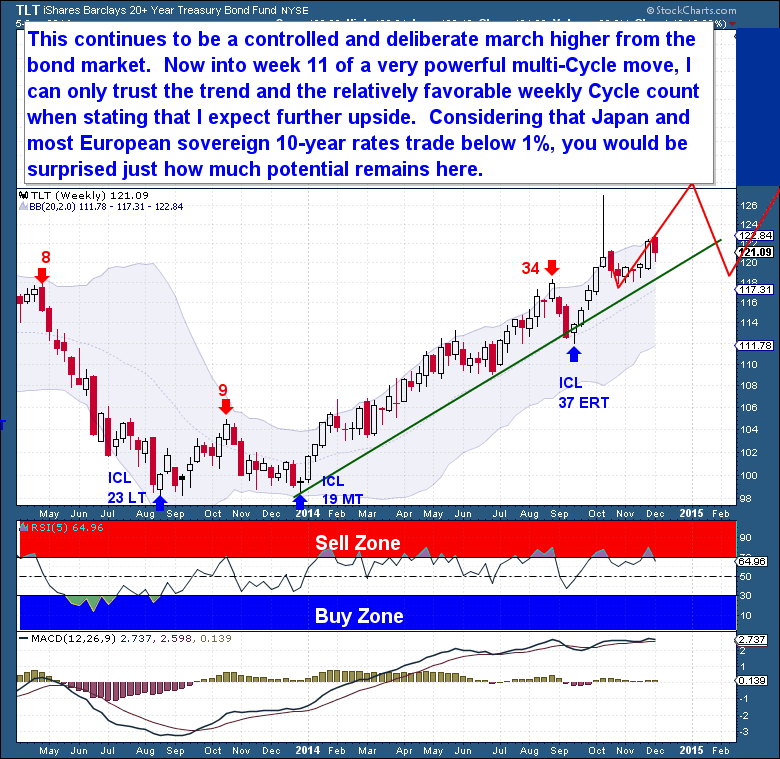
  • World bond market yields are crashing, and in some cases have become negative. Negative rates extend almost to the 10 year bonds, representing an insane level of safe haven buying.
  • The S&P 500 had back-to-back down months for the first time since 2012, the last time we had a major Yearly Cycle Low.
  • The German economy fell 0.3%, its first negative quarter since 2009.
  • Inflation rates in Europe are now negative.
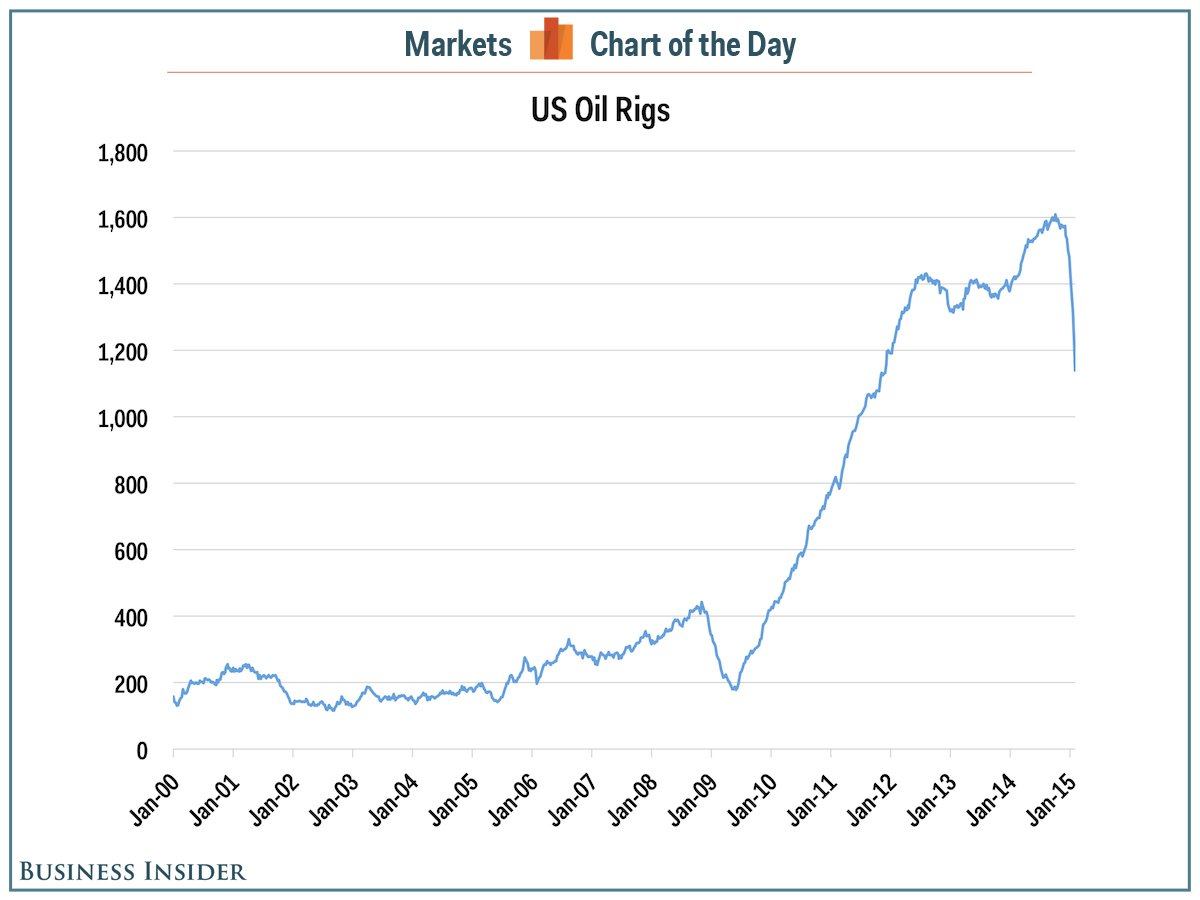
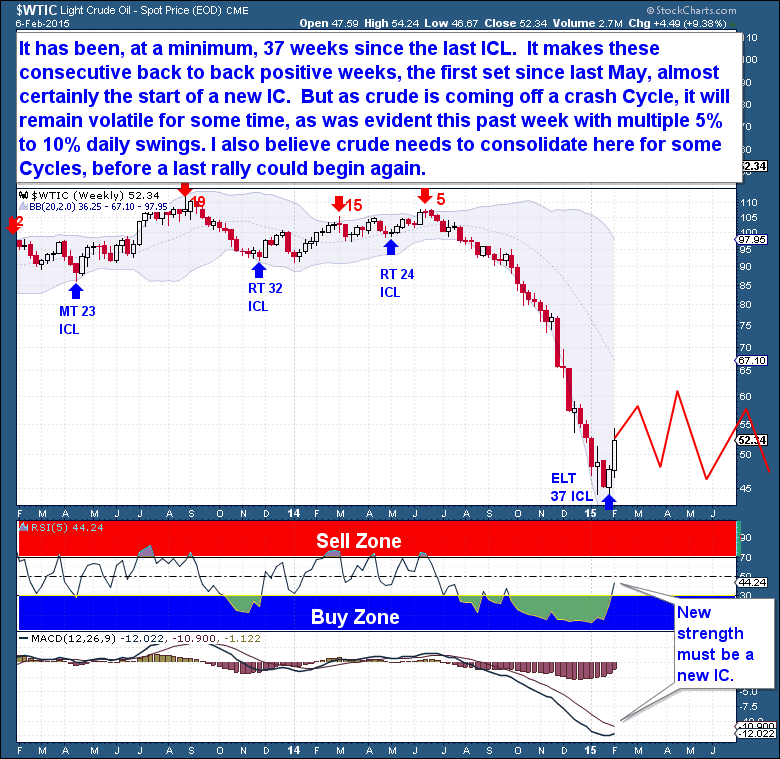
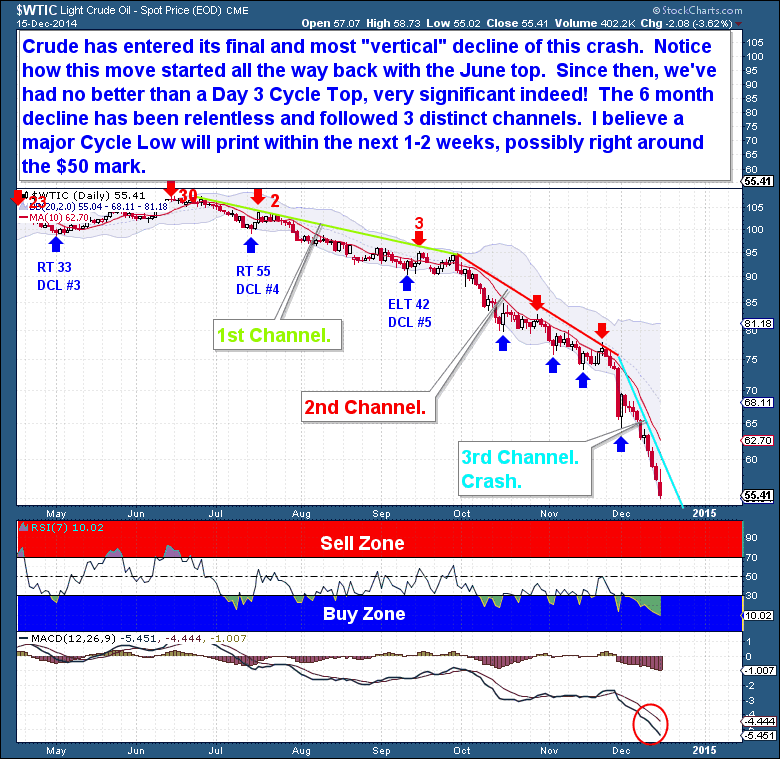
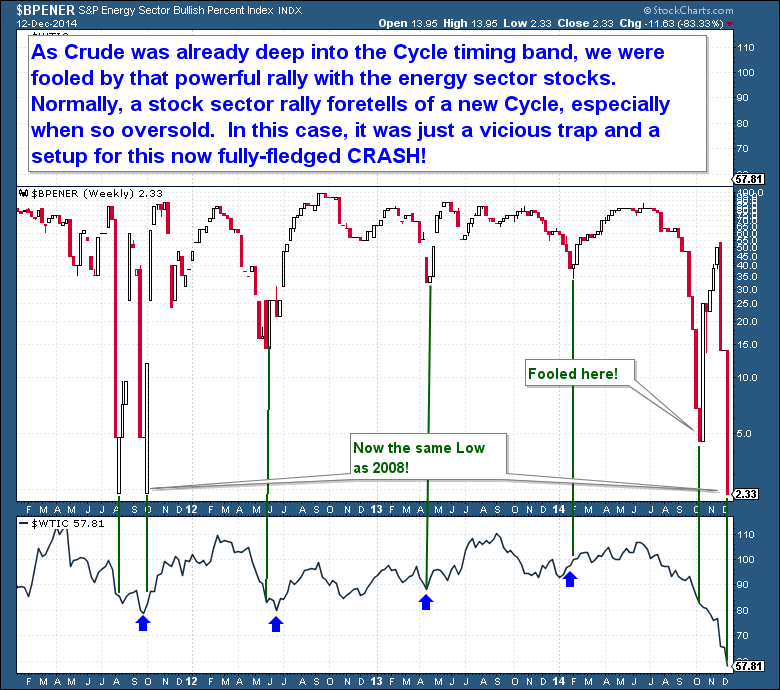
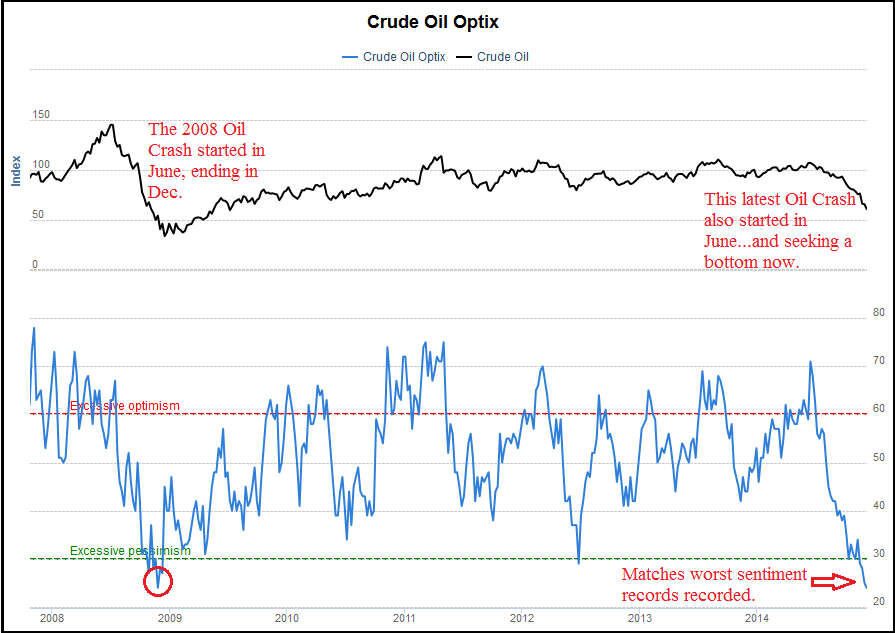
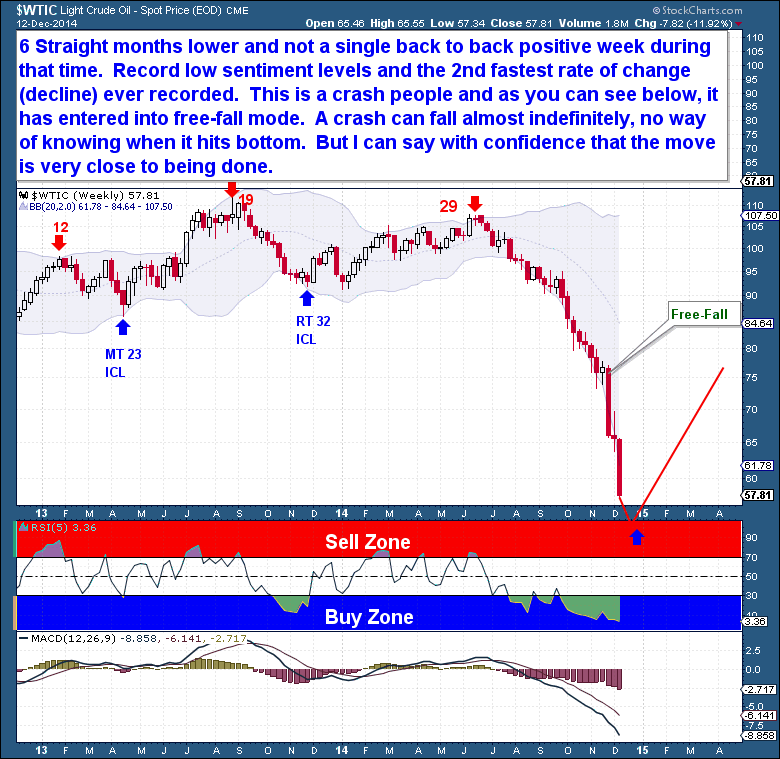
  • Crude oil continues to crash.

In quoting the above statistics, I’m mindful of the fact there are always both negative and positive points that an analyst can use to support a point of view. In this case, though, I honestly feel that the severity and depth of current macroeconomic developments are well outside of the norm. The extreme movements in many markets are interrelated, and seem to be a reflection of a rapidly deteriorating economic landscape.

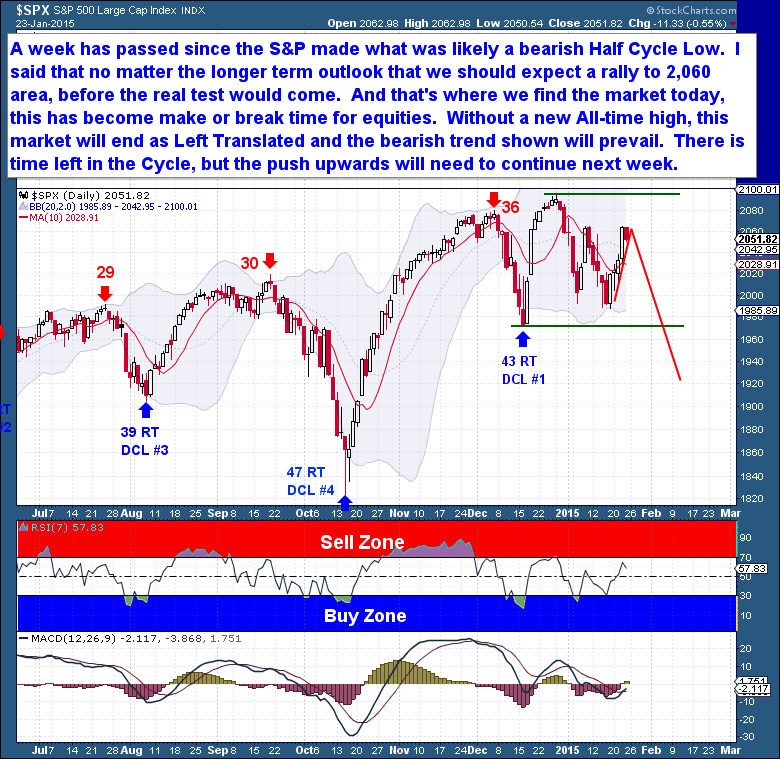
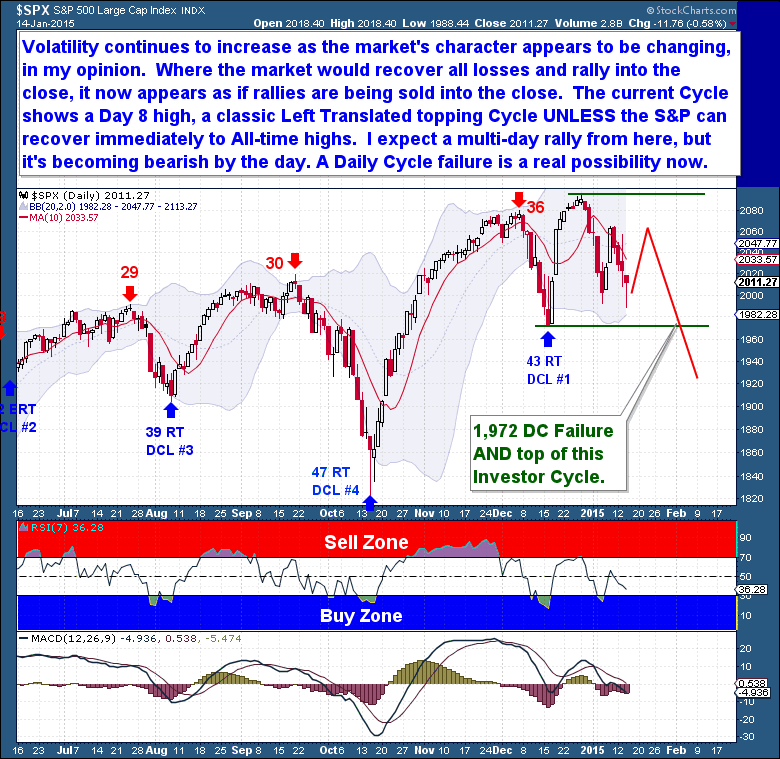
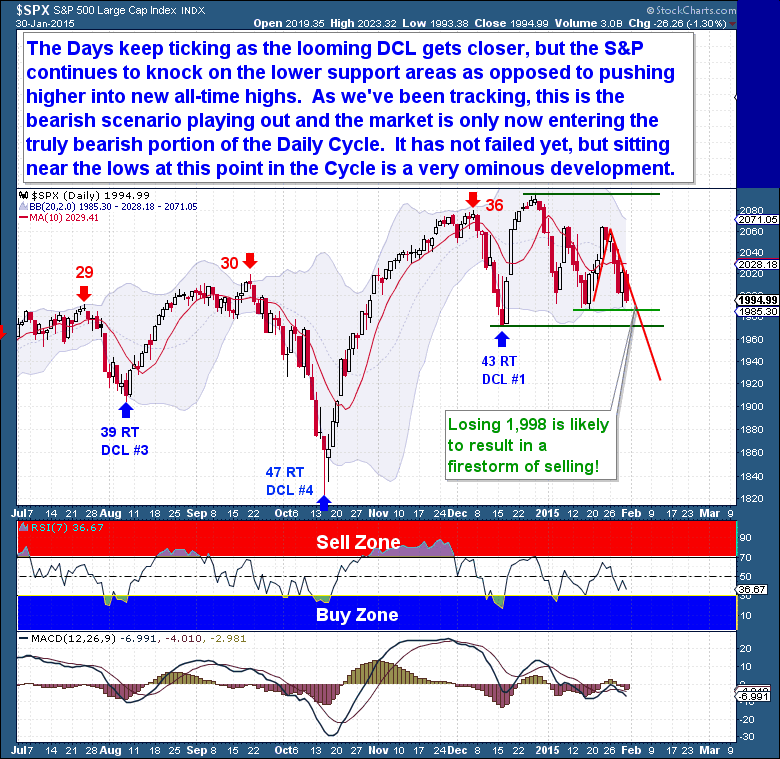
These shifts are showing up as weakness in equity markets. As days tick by, and as the Daily Cycle Low (DCL) draws closer, the S&P has continued to knock against lower support areas. Throughout the past 3 year bull advance, at this point in the Cycle the S&P has pushed higher to new all-time highs. So the current position – bumping against support – is definitely a change in character, one that is telling us that the market may be exhausted. In my opinion, it is also telling us that 2015 is going to be a difficult period for markets. The current Daily Cycle (DC) has not failed yet, but it’s sitting near the lows, and at this point, that’s a very ominous development.

1-30 Equities Daily

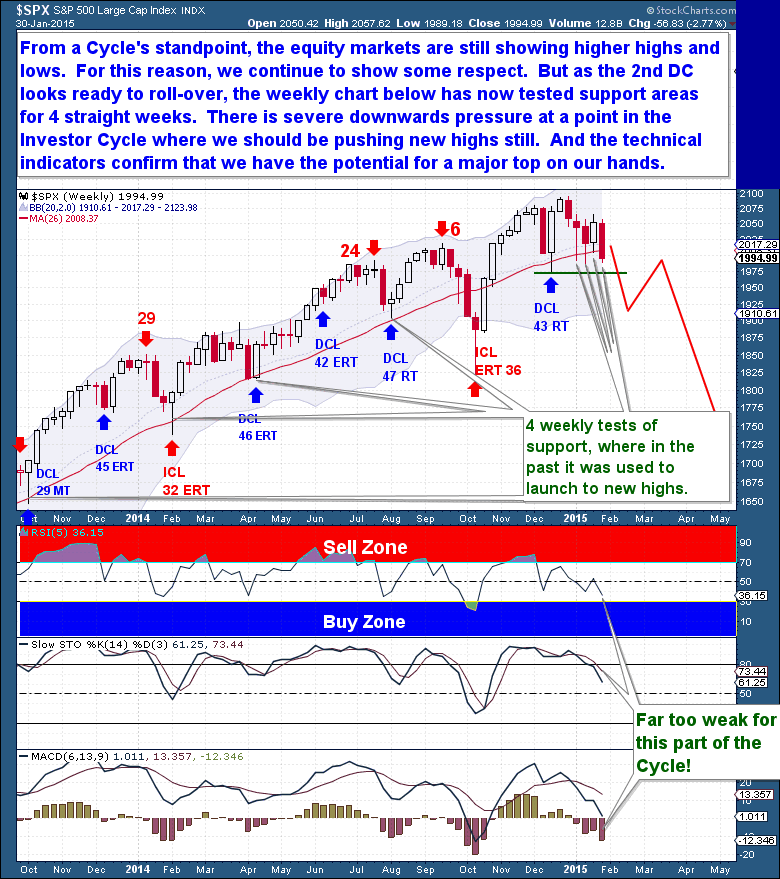
From a Cycle standpoint, the equity markets are still showing higher highs and higher lows. So, following strict Cycle discipline, I could make the argument that the bull market is alive and well. And for this reason, we are forced to show it some respect. But the most surprising development from here would be for equities to roar higher. Such a move would catch many (yet again) by surprise, but I think it’s unlikely this time.

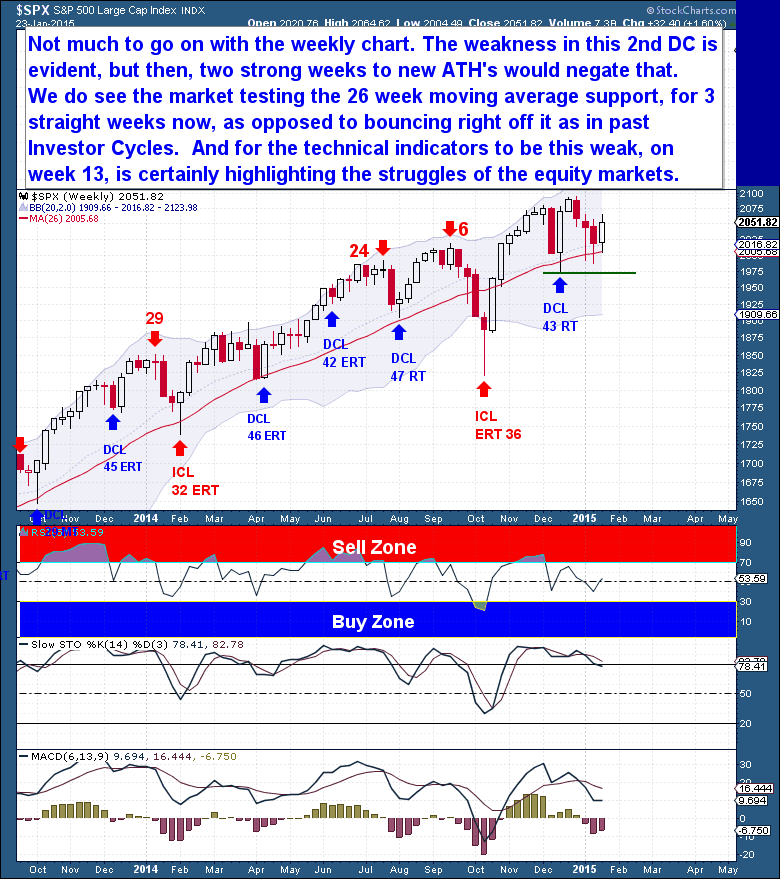
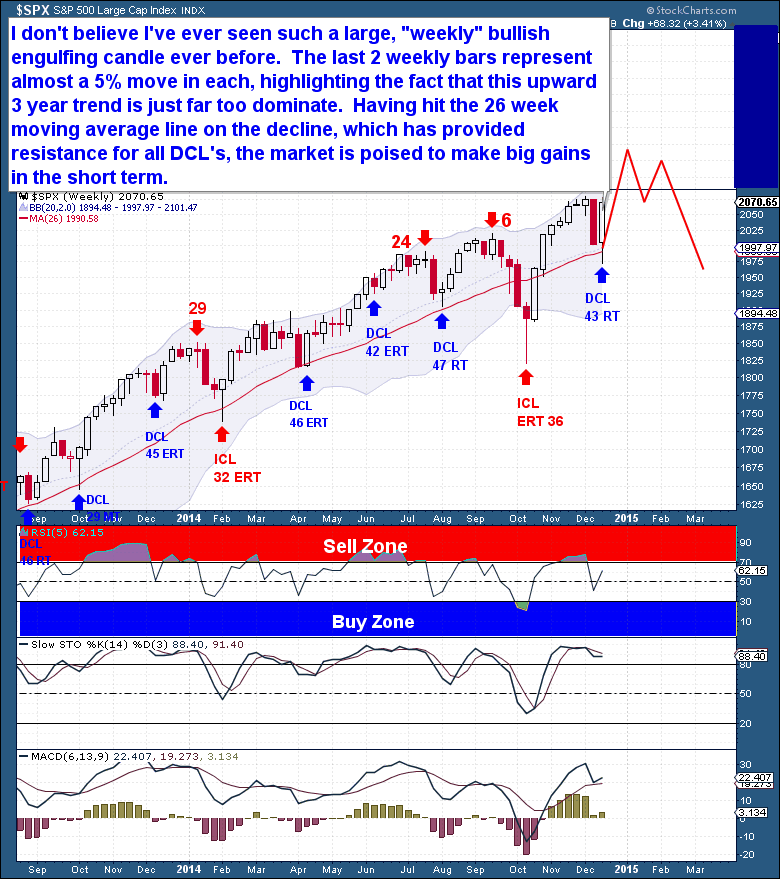
The bull market has had its time, and the bears look like they will finally have a chance to control the action. With the 2nd DC looking ready to roll-over, and with numerous tests of the 26 week moving average in play, the market’s change in character appears ready to play out in prices.

Severe downward pressure is obviously building, and at a point in the Investor Cycle (IC) where a continuing bull market should see us pushing to new highs. The technical indicators confirm that this is an Investor Cycle in its declining phase, and it would be very rare to have the Cycle suddenly change course at this point.

1-30 Equities Weekly

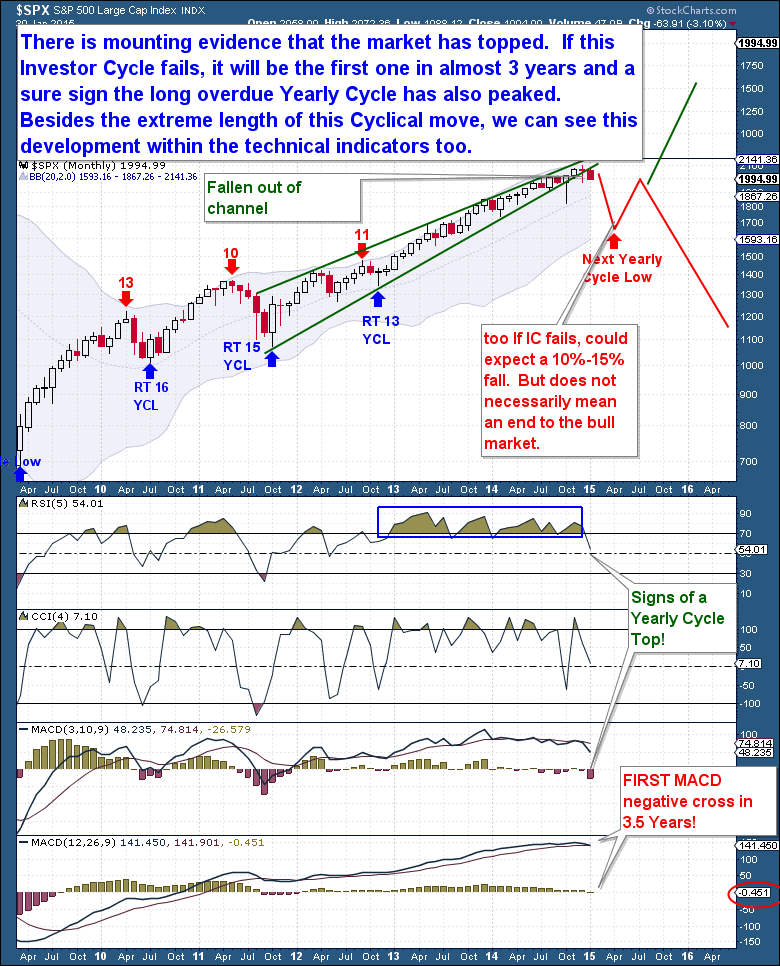
Recent developments are, perhaps, most apparent on a monthly chart. With January’s close, for the first time since the up-move began in 2011, we have a monthly candle that is entirely below the massive bull market channel. This alone is fairly strong evidence to support the idea that the market has topped.

The technical indicators paint a similar picture. The monthly RSI is showing diverging weakness, while the first negative monthly MACD cross since the 19%, 2011 decline is a serious warning sign.   When we combine the negative technical indicators and macro-economic weakness with recent Daily Cycle struggles, and then consider them in the context of an overextended cyclical bull market, there’s compelling evidence that the market is on the verge of a major decline.

If the current Daily Cycle fails in the coming weeks, it will set off a domino effect of cascading Cycle failures. A DC failure would almost certainly result in an IC failure with a move below 1,816. This would be, at a minimum, a deep Yearly Cycle decline by the early spring. From there, how deep equities might fall is really anybody’s guess.

1-30 Equities Monthly

The Financial Tap publishes two member reports per week, a weekly premium report and a midweek market update report. The reports cover the movements and trading opportunities of the Gold, S&P, Oil, $USD, US Bond’s, and Natural Gas Cycles. Along with these reports, members enjoy access to two different portfolios and trade alerts. Both portfolios trade on varying time-frames (from days, weeks, to months), there is a portfolio to suit all member preferences.

You’re just 1 minute away from profitable trades! please visit: https://thefinancialtap.com

Feel free to share this post via the below social media avenues.

Test of Strength

An update to the Jan 15th post “A Cycle Test for Equity Markets” https://thefinancialtap.com/public/a-cycle-test-for-equity-markets

Until the ECB announcement of €1 trillion in QE, the equity markets were struggling to maintain their upside, near-vertical trajectory. The equity market Cycles seemed to have recently changed in character, and were at serious risk of rolling over and failing. And a failure at this point in the Investor Cycle, after such a massive and speculative bull market, would open the door to a significant decline and possibly even signal that the current great bull market was finally over.

But the ECB changed the game. It stepped on to the track and cleanly took the QE baton from the FED. At €60 billion per month until September 2016, the stimulus is massive, and we can’t discount the possibility that it will drive world markets higher until then. Since similarly-sized FED QE programs were credited with driving world equity markets higher, I see no reason why the ECB’s action will have a different outcome.

But, as stated many times before, eventually fundamentals always matter. And in this case, the action by the ECB, although significant, may be too late. With bond yields across Europe dipping into negative territory, my fear is that Europe may be already locked into a powerful deflationary cycle that is impossible to exit.

This idea brings us to the current Daily Cycle, and the importance of the “test” for equities that I’ve outlined recently. I made it clear last week that, regardless of the long term Cycle implications, I expected a rally in equities. And that’s what we got. The market has risen to the 2,060 area, the most likely point for a change in long term trend to present itself. The current DC is on Day 27, but the market has yet to exceed the high set on Day 8. If the market is topping, its current position is exactly where I would expect the rally to stall and fail as price turns lower.

So, this is it! I believe the longer term trend is coming down to the action over a handful of days! If, on the back of a €1 trillion QE program, the market cannot rally 45 points to a new all-time high, there is nothing that can save it. And if the market turns lower from here, it will print a Left Translated Daily Cycle (DC), and is likely to face a terrible and rapid sell-off. As I’ve been saying for some weeks, it’s up to the bulls to prove they want to keep the current rally alive.


1-24 equities daily

I believe that all the important moves will present themselves on the Daily Chart – the weekly chart (below) offers no additional insight. If we see a new all-time high in the coming weeks, it will negate the recent bearish behavior and open the possibility of another 200-300 point rally.

The weakness in the 2nd DC is evident on the weekly chart, with the market repeatedly testing the 26 week moving average support. In the past price would typically just bounce off the 26 wma and move higher, but this time the 26 wma is acting as resistance that could potentially give way. If the market fails to make new ATH’s, we will point to the current developments as evidence that the market was topping.

It should not be lost on anyone that this is the same analysis I presented in the Gold Cycle, but on the other side of the equation. The trend for equities is up, so we should expect a continuation. But as with Gold, there’s a lot of evidence that suggests that the long term trend might be changing. More importantly, we should see the potential for long term Gold and equity market trend changes as symbiotic. Equity market weakness and Gold relative strength are inextricably linked.


1-24 Equities Weekly

Draghi to Deflate Gold

It has been a nice run of late for gold here in the latter part of this Daily Cycle. Gold has closed above the 10 day moving average for 13 straight sessions, which is the type of bullish, Right Translated Cycle behavior we’ve been longing for. And I continue to believe that gold has found a floor here on the longer time-framed Cycle, which means that this positive action is part of a larger move that will eventually show gold has moved out of a wide, 18 month basing pattern.

But all assets move in predictable, ebb & flow patterns, across multiple time-frames. And seeing as though gold is nowhere near a parabolic state, which could negate this expectation, I see the next significant move for gold as much more likely being a quick retrace of the recent gains, leading into an expected Daily Cycle Low.

Based on my Gold Cycle count, today marked Day 21 and a natural (actually slightly past due) topping point. Gold has rarely managed to become this overbought in the past 3 years and whenever it did, gold fell almost immediately back towards a Cycle Low. Today’s intra-day reversal was telling in my opinion, leaving behind an indecision candle and the type of action I would expect around a Daily Cycle Top.


1-21 Gold daily

Let’s also not get too greedy or ahead of ourselves, this Cycle has after-all added $130 and is now overbought. For all these reasons, we should not be at all surprised to see a decline back below the 10dma ($1,246 and rising), over 3 to 7 sessions, to complete the Daily Cycle. Tomorrow’s ECB meeting is obviously widely anticipated and is likely to be market moving.  Therefore, it will likely also be the catalyst to send gold lower into the next Cycle Low.  It would after all actually be an expected, normal and healthy decline at this stage.

The Financial Tap publishes two member reports per week, a weekly premium report and a midweek market update report. The reports cover the movements and trading opportunities of the Gold, S&P, Oil, $USD, US Bond’s, and Natural Gas Cycles. Along with these reports, members enjoy access to two different portfolios and trade alerts. Both portfolios trade on varying time-frames (from days, weeks, to months), there is a portfolio to suit all member preferences.

You’re just 1 minute away from profitable trades! please visit: https://thefinancialtap.com

Feel free to share this post via the below social media avenues.

A Cycle Test for Equity Markets

An element of uncertainty has crept into the equity space as varying external risks are beginning to weigh on this market. The economic risks are certainly there, highlighted by an “average” FED beige book released yesterday. Retail sales were much worse too and they are a leading predictor of where the economy currently stands.

In my opinion, it’s only a matter of time before the world-wide deflationary pull and economic weakness begins to directly impact the US economy. Considering the FED has tapered all QE programs, in an interconnected and dependent world, the US economy has not healed enough to withstand this weakness, let alone continue to “carry the world” on its back.

The rush to bond markets world-wide continues to provide the evidence to support an economic slowdown/recession. Yesterday, the US 30 year bond hit the lowest yields ever recorded, yet market pundits wish to ignorantly remain quiet on its significance.  The flattening of the yield curve represents smart money heading for safety before the oncoming storm.

On a day to day basis, volatility continues to increase and the intra-day swings have  become much more severe and unpredictable. And the market’s character appears to be changing, in my opinion, reflecting the challenges outlined above and more resembling the action seen during past market turning points. Where the market in the past would recover the losses and rally sharply into the close, now it’s the early session rallies that are being sold into the close.


1-14 Equities Daily

The current Cycle shows just a Day 8 high, at this point it remains a classic Left Translated topping Cycle. It will remain Left Translated, meaning it will likely fail, unless somehow the S&P can recover here and rally to make All-time highs. I expect a multi-day rally from here, because we are short-term oversold, but the Cycle picture is becoming bearish by the day now.

If the Dec 1,972 low is lost it will constitute a Daily Cycle failure and print a picture perfect Investor Cycle top.  If that failure does occur, Cycles tell us (with high probability) that the S&P would have at least 8 weeks of sharply lower prices into the next Weekly Cycle Low.

The Financial Tap publishes two member reports per week, a weekly premium report and a midweek market update report. The reports cover the movements and trading opportunities of the Gold, S&P, Oil, $USD, US Bond’s, and Natural Gas Cycles. Along with these reports, members enjoy access to two different portfolios and trade alerts. Both portfolios trade on varying time-frames (from days, weeks, to months), there is a portfolio to suit all member preferences.

You’re just 1 minute away from profitable trades! please visit: https://thefinancialtap.com

Feel free to share this post via the below social media avenues.

Keep It Simple

What a crazy equity market this has become. The swings are just insane. I know in this business what’s “normal” is often tough to define, with the markets fully capable of a variety of wild but still-acceptable swings. Still, I have no qualms in calling the current market “irrational”. It’s a condition often found near major market lows and highs.

It was just two weeks ago that we witnessed the largest weekly selloff in over two years. That 5% decline occurred in a single week and sent the S&P tumbling below 2,000. What followed was a pair of 2% daily gains, packaged in a 3 day rally that added an amazing 100 points. This level of volatility and price fluctuation is indicative of a market controlled by speculative forces. Equities have been divorced from fundamentals for at least 3 years, leaving the market at the mercy of speculative actors: under-performing funds, speculative traders, hedge funds, and programmed bots designed to perpetuate the trend for as long as possible.

Last week, when I expected the Cycle to reverse and turn higher, I drew a projected price trend-line for the S&P that was nearly vertical. It was based on what appeared to be a blow-off move in the making. In hindsight, expecting a 180 point move, in the year’s remaining 15 days, seems unrealistic. Nevertheless, we’ve seen a 100 point rally in just 3 sessions, supporting the idea that we’re witnessing a final blow-off move.


12-20 Equities Daily

There have been a number of surprising elements to the current bull market, but I don’t believe I’ve ever before seen such a large bullish engulfing candle on the weekly chart. The last 2 weekly bars represent an almost 5% move in each direction, with this past week highlighting the dominance of the upward 3 year trend.

The 26 week (6 month) moving average has acted as solid support for the current 3 year move. Every time the S&P has tagged or moved below the 26wma during a DCL, price almost immediately bounced back to the upside. Because the S&P clearly put in a Day 43 DCL early last week, it’s in the early stages of a Daily Cycle that could potentially rally for 30 sessions. The upside potential from this point is massive. If the trend continues, the market could add another 150 points in the current DC. And if my theory of a final blow-off move is correct, the S&P could add that 150 points in a very short period of time.


12-20 Equities Weekly

The point is that all evidence points to continued upside gains. For a fundamentalist, the market at these levels is difficult to comprehend. I appreciate that people trade and invest with different objectives and on different time-frames, so if you just can’t see the market moving higher because of fundamentals, step away from trading. And in no instance should you let your bias lead you to bet against the market through a Short trade. You should either accept the market’s trend and ride with it, or acknowledge that you do not understand the market and choose to step aside. Either one is fine. But trying to bet against the market before a declining trend has been established is a very low probability trade.

The Financial Tap publishes two member reports per week, a weekly premium report and a midweek market update report. The reports cover the movements and trading opportunities of the Gold, S&P, Oil, $USD, US Bond’s, and Natural Gas Cycles. Along with these reports, members enjoy access to two different portfolios and trade alerts. Both portfolios trade on varying time-frames (from days, weeks, to months), there is a portfolio to suit all member preferences.

You’re just 1 minute away from profitable trades! please visit: https://thefinancialtap.com

Feel free to share this post via the below social media avenues.


An Epic Blowout

The FED’s easy money has encouraged rampant energy speculation and over-investment, resulting in more than $500 billion in new loans and investments in just the past 4 years. And so long as Crude prices stayed comfortably above $90, investments made money and everyone was happy. But once energy prices started falling, the decline quickly became a negative loop-back effect because the very high levels of leverage could not tolerate the move. Whenever asset prices fall in a highly levered market, there is often a sudden lack of liquidity to absorb the speculators’ need to unwind leverage, leading to desperation and fire sales. In the case of energy, the sudden disappearance of “investors” highlights just how speculative the underlying market had become.

It’s not exactly a Black Swan event, since Crude and other assets occasionally move with incredible ferocity. But to a highly levered and speculative population who chose to ignore the risks as being far too improbable to worry about, it’s a situation where debt cannot be offloaded at any reasonable price. At $55 bbl Crude prices, much of the new debt simply does not work, meaning that significant energy company junk bond defaults will occur. Although this is obviously bad for the energy complex, it also has very real implications for broader systemic risk.

The only saving grace may be that it appears that Crude has entered the final, vertical decline of the crash. A bottom in the $50 range is in no way guaranteed, but it is likely that the low will come in the near future. Notice on the below chart that the current move down started from a June top. Since then, we’ve had no better than a Day 3 Cycle top, showing just how extremely Left Translated recent Cycles have been. The chart also shows how relentless the downward move has been, and the 3 distinct channels it has taken. Within each channel, the declines have taken on a steeper, more vertical aspect, to the point that Crude prices are now near free-fall.


Crude blowout

When a market enters into crash mode, there is no way to know where it will bottom. Unlike Crude, the energy producers have, to date, held up relatively well. And recently, they put in a very convincing counter-trend rally at the same time Crude appeared to be finding a bottom. But unless Crude does find a bottom, and quickly, the energy producers will, I believe, be punished with extreme prejudice, as we’ve yet to see “crash-like” selling in many of the names.

As is clear on the below chart, Crude was already deep into the timing band for a Low when energy producers rallied, fooling everyone into believing that a new Cycle was already underway. Normally, a sector rally in equities foretells a new Cycle, especially in an oversold, extended asset. In this case, it was just a vicious trap, a setup for the crash we’re seeing now!


12-13 Crude Stock BP-index

I’ve shown Crude’s sentiment chart a number of times in the past few months, so I know it should be taken lightly when used to discuss Cycle timing. But I’m presenting it again because we now have a situation where sentiment is matching that seen during the massive crash of 2008. There comes a time, even during a bear market, where the market can’t absorb more selling, where it becomes exhausted of sellers. I’m not sure if we’re there yet in Crude, but based on this chart, it’s clearly imminent.


12-13 Crude Sentiment

This crash has been a long time in the making, and has seen 6 consecutive months of lower prices without a single instance of back-to-back weekly gains! As a result, we have record low sentiment levels on the heels of the 2nd fastest rate of change (decline) ever recorded. This is a crash, no way around it. The effects on the industry will be long lasting.

As we can see below, price has entered free-fall. Cycle timing is out the window in this sort of scenario, as price can fall almost indefinitely, technically to zero. There is no way of knowing when it will bottom, but of interest is that the 2008 crash also began with a June top and ended with a December low, a 6 month decline. All that we can say with confidence is that the current move down should be very close to finished.


12-13 Crude Weekly

The Financial Tap publishes two member reports per week, a weekly premium report and a midweek market update report. The reports cover the movements and trading opportunities of the Gold, S&P, Oil, $USD, US Bond’s, and Natural Gas Cycles. Along with these reports, members enjoy access to two different portfolios and trade alerts. Both portfolios trade on varying time-frames (from days, weeks, to months), there is a portfolio to suit all member preferences.

You’re just 1 minute away from profitable trades! please visit: https://thefinancialtap.com/landing/try#

Feel free to share this post via the below social media avenues.

Bonds Still Have Legs

A solid U.S. employment report on Friday sparked a sell-off in the U.S. government bond market. And with the positive report, the FED is now under pressure to raise rates sooner than the market had been expecting. Considering that the bond market is already deep enough in the current Daily Cycle, it was surprising to see price hold above the 10dma to close out the week.

In reality, even more than the Gold market, the bond market had every reason to sell off aggressively on Friday. The Cycle timing was supportive of a decline, and the massive 2014 rally and overbought nature of the bond market made it ripe for a “realization” sell-off.

Considering the massive jobs number, the fact that bonds didn’t sell off shows just how much investors believe that the equity markets are carrying outlandish risk. This is a cyclical bull market in bonds because there is an underlying rotation into bonds at the same time speculative (high risk) capital continues to flow into equities.


12-6 Bonds Daily

If the equity markets were correct, and the economy was truly doing well, the bond market would be making new lows instead of new highs! Bonds continue to be gripped in a controlled, deliberate march higher, reflecting a cyclical bull market.

As the bond market enters week 11 (of a standard 22-26 Week Cycle) within a powerful, multi-Cycle move, I can only trust the trend and the relatively favorable weekly Cycle count when declaring that I expect further upside. And considering that 10-year Japanese and German bonds trade well below 1%, while (most) European sovereign bonds trade below 2%, the US 10 year bonds yielding 2.3% shows us there is a surprising amount of upside potential remaining in the bond market.


12-6 Bonds Weekly