Test of Strength
An update to the Jan 15th post “A Cycle Test for Equity Markets” http://thefinancialtap.com/public/a-cycle-test-for-equity-markets
Until the ECB announcement of €1 trillion in QE, the equity markets were struggling to maintain their upside, near-vertical trajectory. The equity market Cycles seemed to have recently changed in character, and were at serious risk of rolling over and failing. And a failure at this point in the Investor Cycle, after such a massive and speculative bull market, would open the door to a significant decline and possibly even signal that the current great bull market was finally over.
But the ECB changed the game. It stepped on to the track and cleanly took the QE baton from the FED. At €60 billion per month until September 2016, the stimulus is massive, and we can’t discount the possibility that it will drive world markets higher until then. Since similarly-sized FED QE programs were credited with driving world equity markets higher, I see no reason why the ECB’s action will have a different outcome.
But, as stated many times before, eventually fundamentals always matter. And in this case, the action by the ECB, although significant, may be too late. With bond yields across Europe dipping into negative territory, my fear is that Europe may be already locked into a powerful deflationary cycle that is impossible to exit.
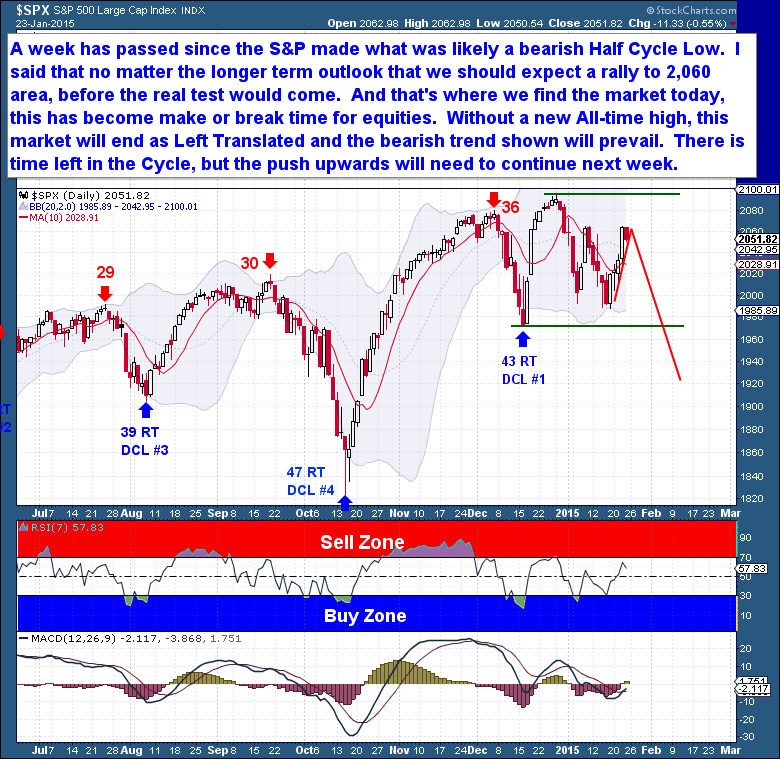
This idea brings us to the current Daily Cycle, and the importance of the “test” for equities that I’ve outlined recently. I made it clear last week that, regardless of the long term Cycle implications, I expected a rally in equities. And that’s what we got. The market has risen to the 2,060 area, the most likely point for a change in long term trend to present itself. The current DC is on Day 27, but the market has yet to exceed the high set on Day 8. If the market is topping, its current position is exactly where I would expect the rally to stall and fail as price turns lower.
So, this is it! I believe the longer term trend is coming down to the action over a handful of days! If, on the back of a €1 trillion QE program, the market cannot rally 45 points to a new all-time high, there is nothing that can save it. And if the market turns lower from here, it will print a Left Translated Daily Cycle (DC), and is likely to face a terrible and rapid sell-off. As I’ve been saying for some weeks, it’s up to the bulls to prove they want to keep the current rally alive.
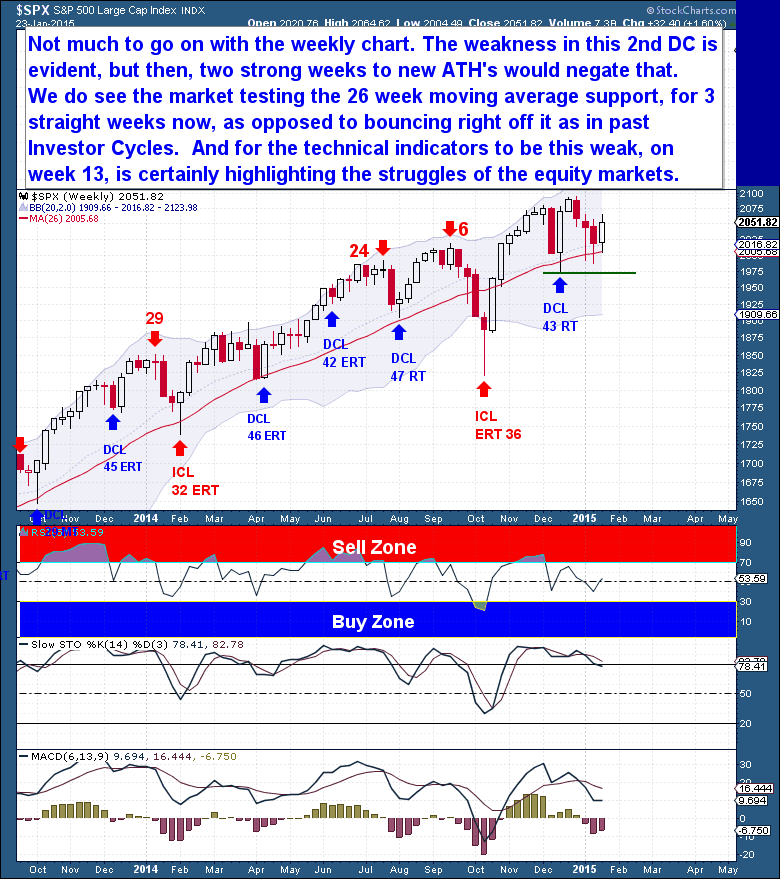
I believe that all the important moves will present themselves on the Daily Chart – the weekly chart (below) offers no additional insight. If we see a new all-time high in the coming weeks, it will negate the recent bearish behavior and open the possibility of another 200-300 point rally.
The weakness in the 2nd DC is evident on the weekly chart, with the market repeatedly testing the 26 week moving average support. In the past price would typically just bounce off the 26 wma and move higher, but this time the 26 wma is acting as resistance that could potentially give way. If the market fails to make new ATH’s, we will point to the current developments as evidence that the market was topping.
It should not be lost on anyone that this is the same analysis I presented in the Gold Cycle, but on the other side of the equation. The trend for equities is up, so we should expect a continuation. But as with Gold, there’s a lot of evidence that suggests that the long term trend might be changing. More importantly, we should see the potential for long term Gold and equity market trend changes as symbiotic. Equity market weakness and Gold relative strength are inextricably linked.