Fundamentals No Longer Matter
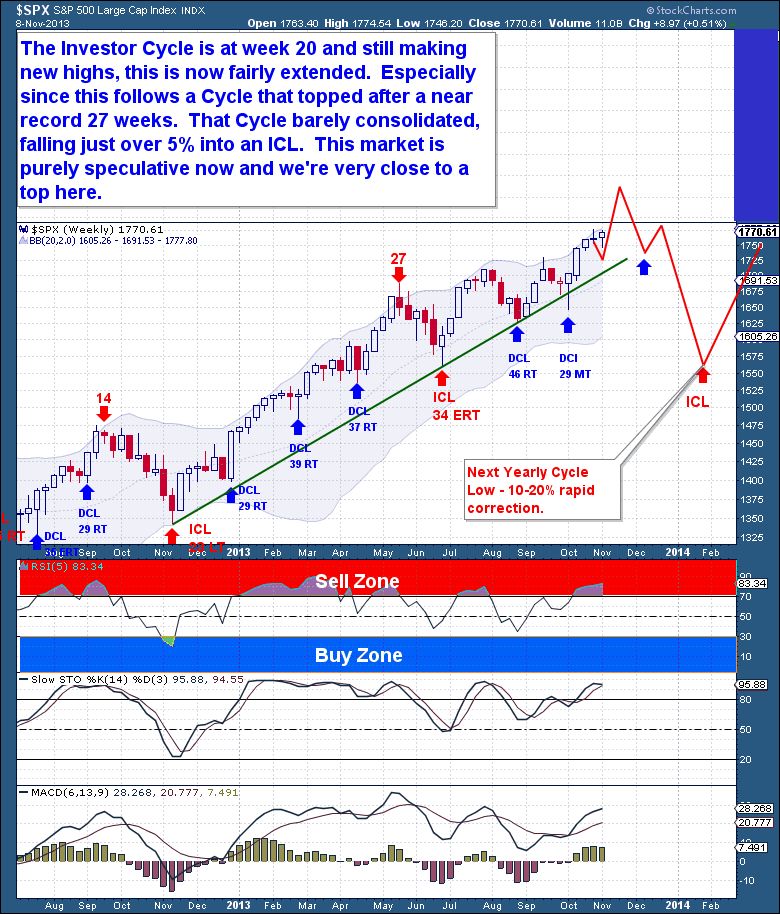
Last week’s close gave the S&P its first 3 week winning streak in 3 months, in the process putting the recent Investor Cycle Low firmly in the rear view mirror. It looks as if we now have a continuation of the dominant trend on our hands. I’ve noted on numerous occasions just how stretched the current Yearly and cyclical bull market Cycles have become, but it’s impossible to ignore the strength of the current runaway move.
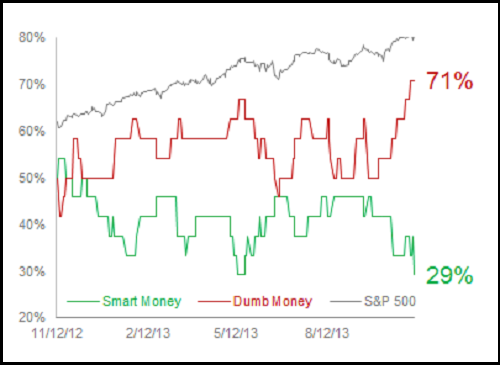
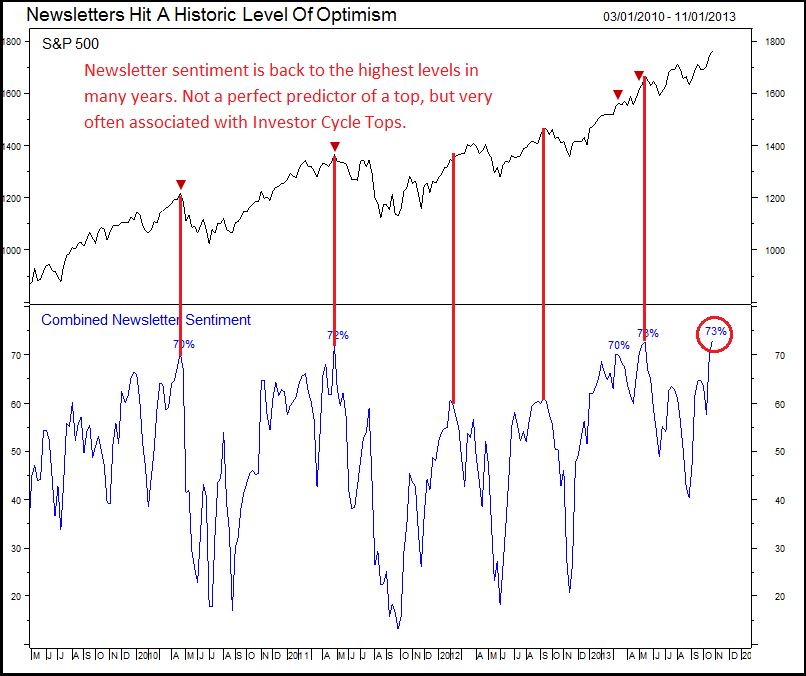
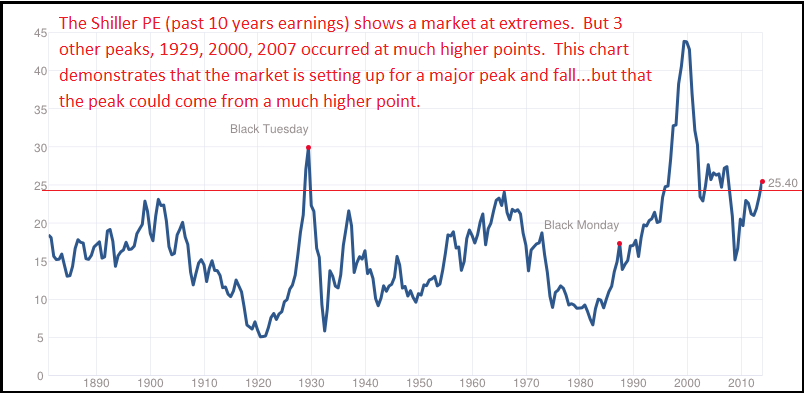
The current conditions appear to be mirroring past cyclical market tops, with valuations ceasing to be a consideration for buying. At the end of every bull market, the fear of missing out, of being left behind, becomes the dominant fear. This couldn’t be more evident than in Facebook’s purchase of messaging provider Whatsapp. I don’t know what they were smoking in the Facebook conference rooms, but they paid $19 billion for a business that has 60 employees and virtually no revenue. That is the very definition of business insanity, found always near the top of great bull markets.
Toward the end of every cyclical bull market, fundamentals no longer matter. Instead, a collective and self-reinforcing speculative rally grows in statue as a market climbs to its peak. That’s where the equities market finds itself today, caught in a 2 year runaway move that either continues to accelerate higher or stalls and reverses. At this point in the current bull market, a move like the current one will eventually end at a major market peak.
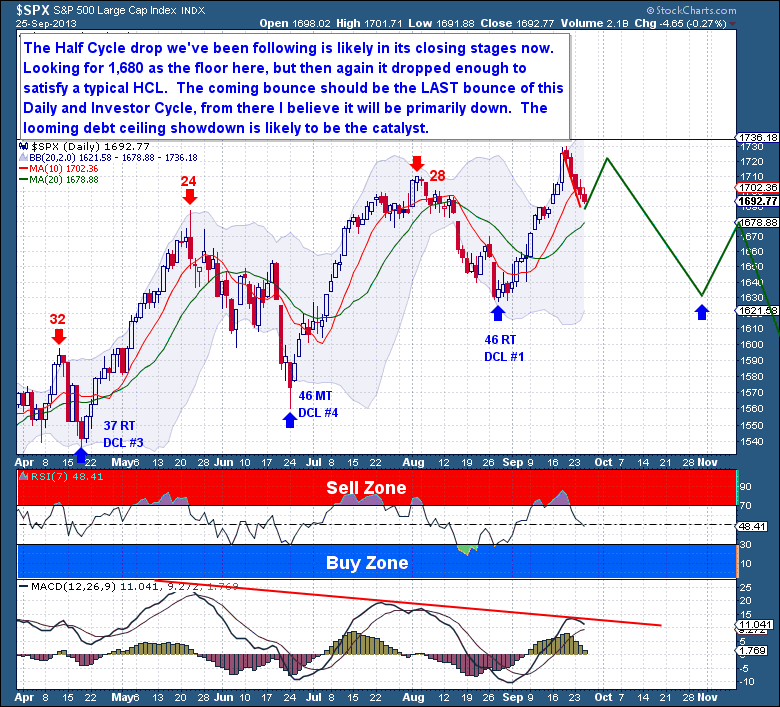
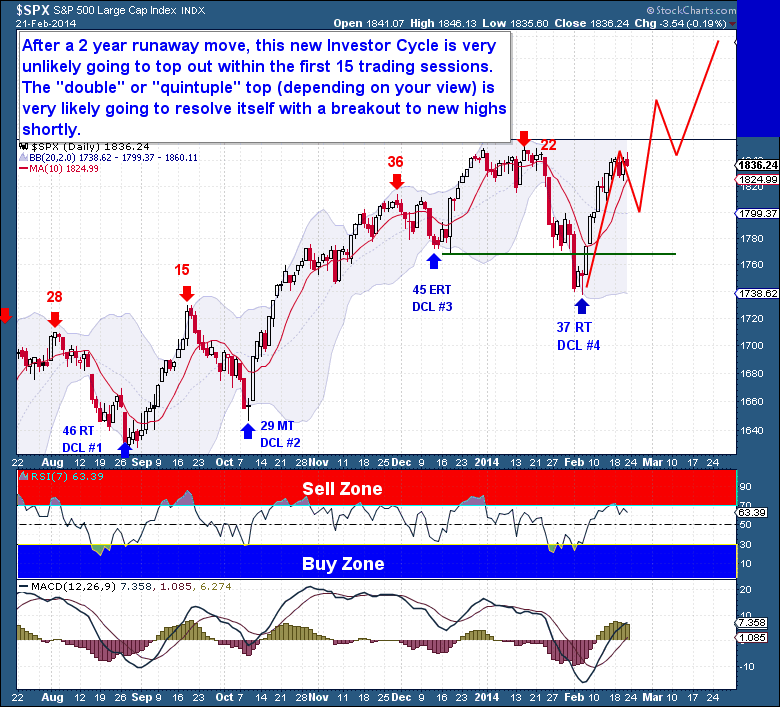
 For this reason, it’s unlikely that the new Investor Cycle will top after the first 15 trading sessions. The double top on the Daily chart looks more like a consolidation point below a key pivot than something more ominous. The equity markets have recovered the entire previous ICL decline in just 2 weeks, so it is only natural for equities to pause and consolidate below the all-time highs.
I doubt that the current consolidation pause is finished – it is still early in the Daily Cycle and more back-filling is likely needed to prepare for another more sustained bull run. But if Cycles continue to follow recent patterns – and they should – it will be only a matter of time before equities launch into all-time high territory…and beyond.
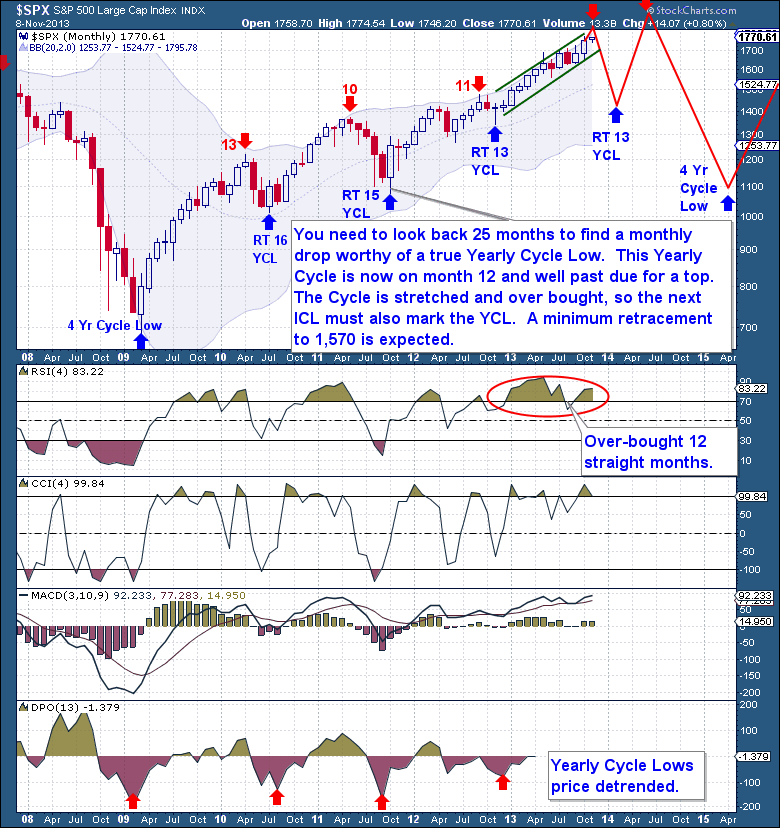
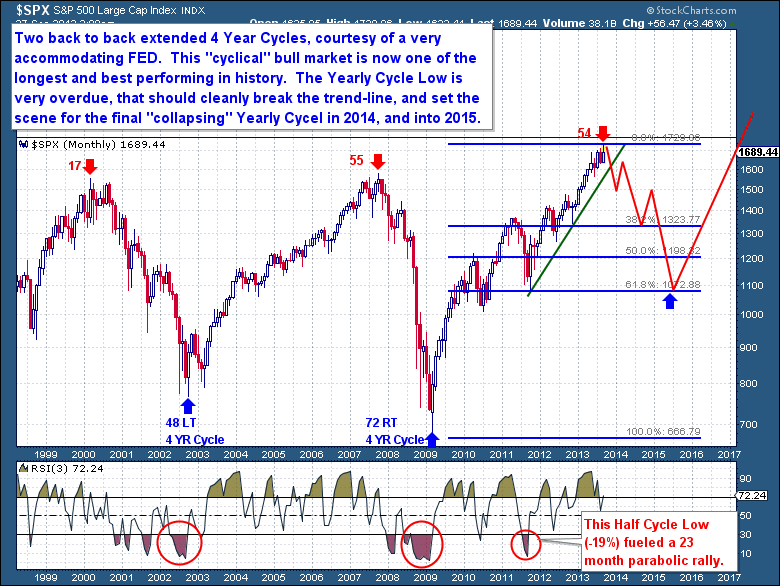
 The last two Investor Cycles ran for 32 weeks and did not top until just 5 and 3 weeks before the Cycles ended. Both ICs were near records in both length and performance. Including the last 5 Cycles in aggregate, we now have stretched (runaway) Yearly and 4 Year Cyclical Cycles.
Ordinarily, we would be on the lookout for a shorter and Left Translated Investor Cycle. A Left Translated Cycle would provide the necessary room for the IC to fall into a deep, Yearly Cycle Low in the late spring. But two important facts should be kept in mind. First, this is just week 3 of the Investor Cycle, and even the bearish case supports another 5 weeks higher. Second and above all else, this is a runaway bull market move, where price and trend should trump all normal analysis. As we know, irrational and speculative bull markets can, and do, extend for much longer and further than imaginable. 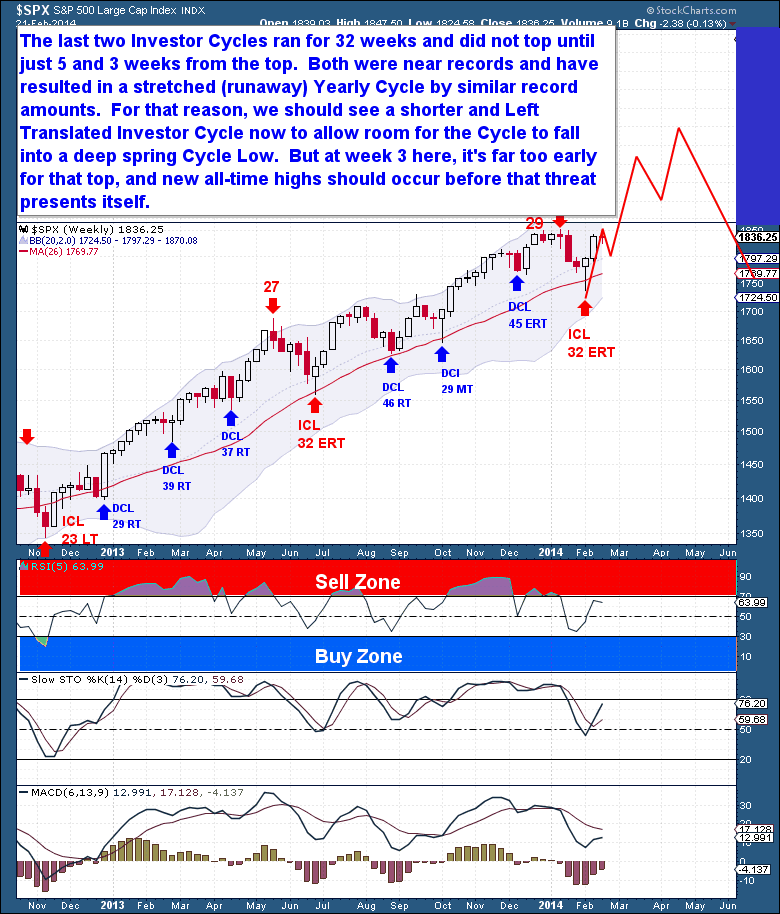
The Financial Tap publishes two member reports per week, a weekly premium report and a midweek market update report. The reports cover the movements and trading opportunities of the Gold, S&P, Oil, and $USD Cycles. Along with these reports, members enjoy access to three different portfolios and trade alerts. As these portfolios trade on varying timeframes (from days, weeks, to months), there is a portfolio to suit all member preferences.
LIMITED TIME PROMOTION. You're just 1 minute away from profitable trades! please visit http://thefinancialtap.com/landing/try# AND ENTER PROMO CODE: 29off This will reduce ANY product by $29 (including the annual).