Midweek Market Update – Oct 22nd
This content is for members only

This content is for members only
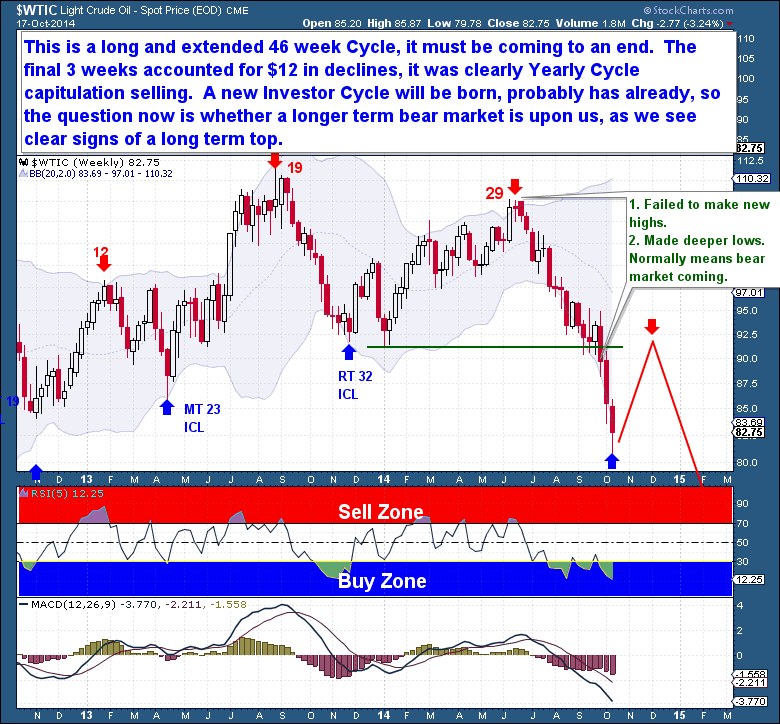
The presence of a new series of lower tops and lower lows on the Investor Cycle chart is suggesting that 2015 is likely to be a very challenging period for the energy markets. Like all assets, energy moves through Cycles of varying timeframes. I believe that the record investment of the past 5 years has resulted in too much production, which will lead to a period of business consolidation and bankruptcy.
This content is for members only
This content is for members only
The equity markets are finally seeing action that has even the most hardened bulls running scared. In the past, I’ve been quick to dismiss selling periods – Cycle Lows – as natural regression-to-the-mean events. In a bull market, an oscillating Cycle pattern of two steps forward and one step back is what drives an asset higher. But this time is different…two steps back is completely out of character. So much so, that I now believe that the 3.5 years bull market is now in serious trouble.
If we were to look for reasons to explain the recent selling, there are plenty to be had. The most likely is not a specific piece of news or single data point, but that the collective herd of market participants is fickle and can be easily spooked. The current bull market has broken plenty of records, including the length of time – more than 3 years – since a 10% correction. This has resulted in double-digit market gains for consecutive years, and a near vertical rise over a sustained period of time. Against the backdrop of a soft world economy, this performance is nothing short of remarkable.
This content is for members only
This content is for members only
This content is for members only
This content is for members only
Everywhere you turn today, gold is again being dismissed as a relic of the past, totally worthless, non-producing, with no place in any modern day portfolio. During the past 3 years, the gold complex has experienced the progressive stages of fear, capitulation, and despair, all classic bottoming phases of a long term Cycle. The question now is whether this high level of apathy is a symptom of a new secular bear market or a period of “stealth smart money” accumulation.