Gold Sector Shining in a New Cycle
The charts below are from this past weekend. This post is an excerpt from the Sat 18th member report and offered a roadmap for the coming 4-6 weeks. There is a limited time promotion code available at the end of this post.
Last week’s member report was titled “If it looks like a duck…” because the evidence was there to suggest gold was in a new Investor Cycle. We established long positions in advance because powerful new Investor Cycles make it difficult for latecomers to buy. And now I’ve seen the type of action, across the entire precious metals complex, which has me convinced this is a new Gold Investor Cycle. Obviously, this is exciting, because after a prolonged decline, we now see the potential ahead for a longer term trend change. It does not, at this stage, negate the primary downtrend or confirm an end to this 2+ year bear market. Only that the gold sector is in the process of rallying within a new Investor Cycle.
If the bear market lives on, then this new Investor Cycle will top out sooner, probably somewhere between weeks 7 and 10 (currently on week 3). The rally would come in the form of a “reversion to the mean” event only, which from experience they can be relentless and powerful moves. But as members know, I don’t think that’s what we have on our hands. It remains my opinion that gold has put in a major bear market low and the process of establishing a base under the $1,921 all-time highs is now playing out. I called the June Investor Cycle Low (ICL) as it occurred, in real-time, because I really felt it was the 4 Year Cycle and Bear Market low. Since then, I built my primary framework around the idea that the Investor Cycle was going to retrace and fall to test the June bear market lows.
I have been unwavering in this belief and it has remained my “primary” expectation throughout. Not once in the last 4 months have I expected otherwise. The action unfolding today has been depicted within chart after chart and numerous member reports. There comes a point where it just becomes exhausting for me, and repetitive for the reader, to state the same observations over and over again. So instead of the usual commentary, I will instead present the following Cycle charts which clearly illustrate the explosive nature of the current gold Cycle setup.
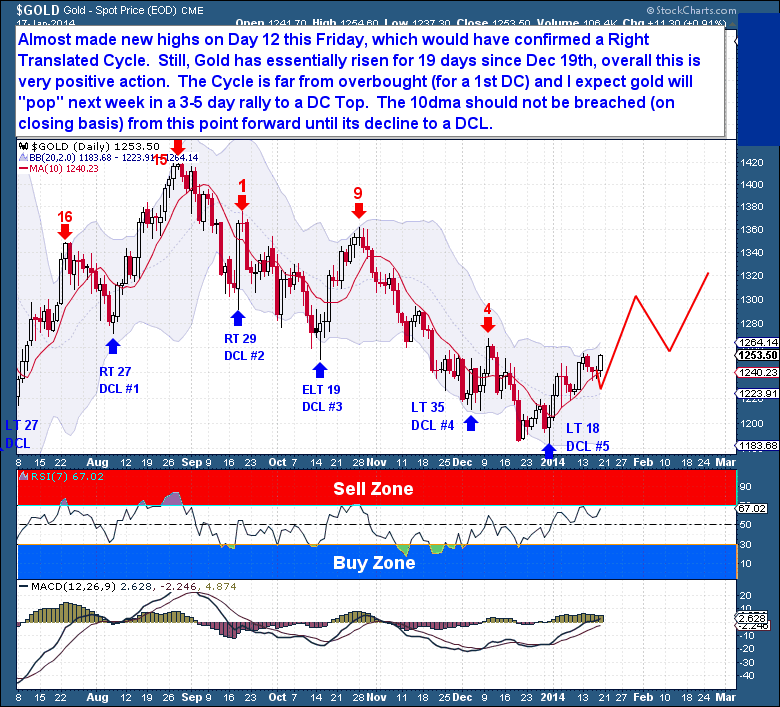
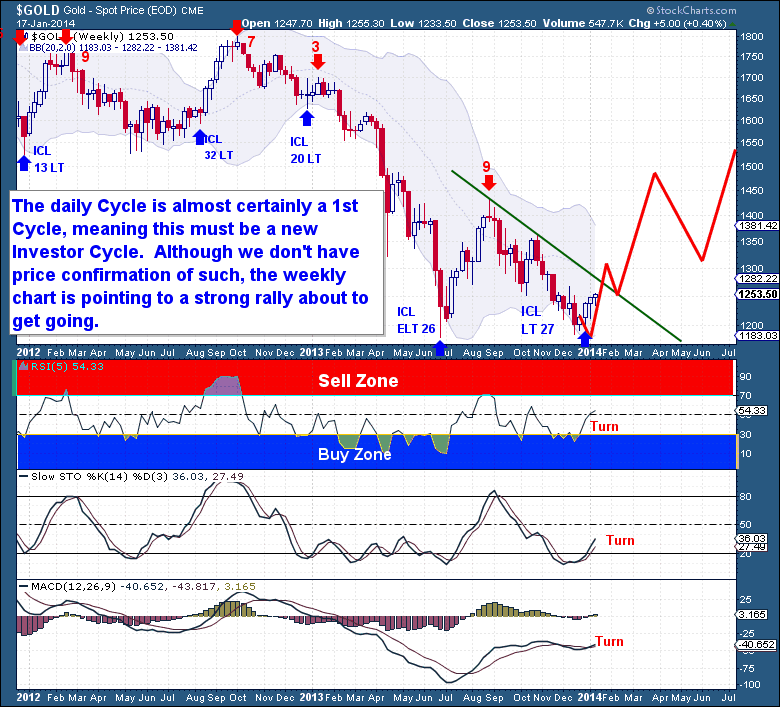
Gold threatened to drop mid-week, but instead by Friday it sat right below the highs of the Cycle. Gold ended just shy of making new highs, which being Day 12, would have confirmed a Right Translated Cycle. Generally, gold’s 1st Daily Cycle (going back 14 years) has averaged 29.4 days and topped on day 19.7. Also, this Cycle to date is far from overbought (especially for a 1st DC) so I expect gold will "pop" next week in what is likely to be a 3-7 day rally to a DC Top.
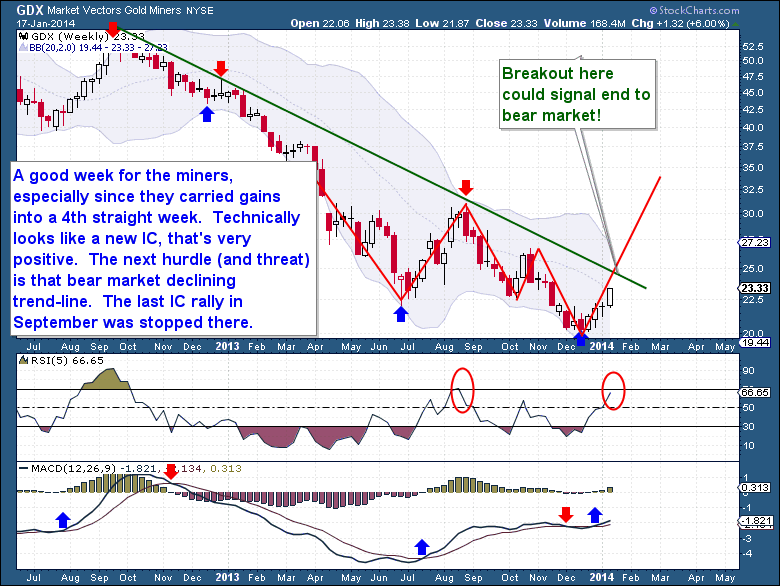
 Followers of the gold sector must be encouraged by the early strength shown by the miners. Many of the junior names are breaking out on very high volumes; some are up 30-50% already! The seniors are being accumulated too; most of them are up over 10% off the lows. GDX has broken its IC trend-line and turned bullishly higher. There is no doubt, the miners are pricing in a new gold Investor Cycle.
Already up 4 straight weeks, the miners might be in need of some cooling off. But that should be brief, at which point the only upside hurdle they face is the intimidating bear market declining trend-line. The last IC rally in September was stopped there and I suspect it will provide resistance this time around too. That is the dividing line between the 3 year bear market and the promise of open air and a longer term rally.
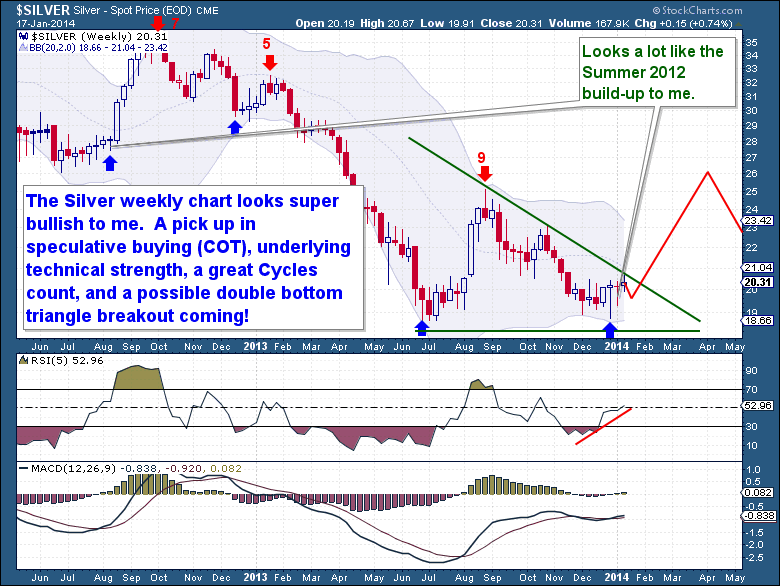
 I just cannot emphasize how much I like the silver chart, to me it looks ready to pop in what could be a 20% rally in as little as 4 weeks. We know silver is capable of such moves and I see the current coiling action being extremely similar to the move which occurred over the summer of 2012 (see chart below). We have a good pickup in speculative buying (COT) while the underlying technical strength of this Cycle looks great. The Cycle count is very favorable and we have what looks to be a massive double bottom triangle breakout coming!
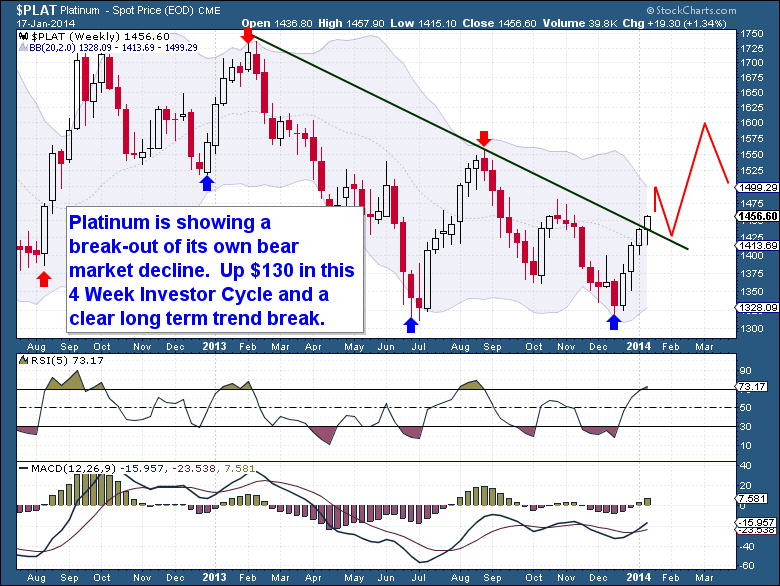
 Platinum is getting some love too; it’s breaking-out of its own bear market decline. Up $130 in just the first 4 weeks, it shows that the entire sector is attracting interest. It is overbought, but with a double bottom in place it appears to be in the early stages of a new trend.
 To the naked eye, from a price perspective, gold has languished to some extent. But all around it, the sector is gaining momentum. Technically, gold has turned higher perfectly within the Cycle timing band, so there isn’t a reason to doubt this Investor Cycle. It has after-all just put in its first consecutive 4 week rally in 1.5 years. But we’re at the point now where I want to see some follow through and a break of the $1,255-$1,267 range.
As this Cycle begins to gain more followers (speculators) they will help to accelerate the gains in this Cycle. There is some strong resistance up to the $1,267 area and I don’t believe the weekly declining trend-line will be given up easily. What I would love to see is a rally next week to break that trend-line, followed by a DCL that comes back to tag the trend-line. Once gold finds that 1st DCL it will have far less resistance ahead. The setup would be perfect for what could be a very powerful 2nd Daily Cycle.
 As this is the start of a new Investor Cycle, we have confirmation that the Investor Cycle did not fail. This might seem irrelevant, but I can assure you that in a downtrend it is a welcomed event. It’s not definitive evidence that the downtrend has ended, but it’s the first prerequisite for a change in trend.
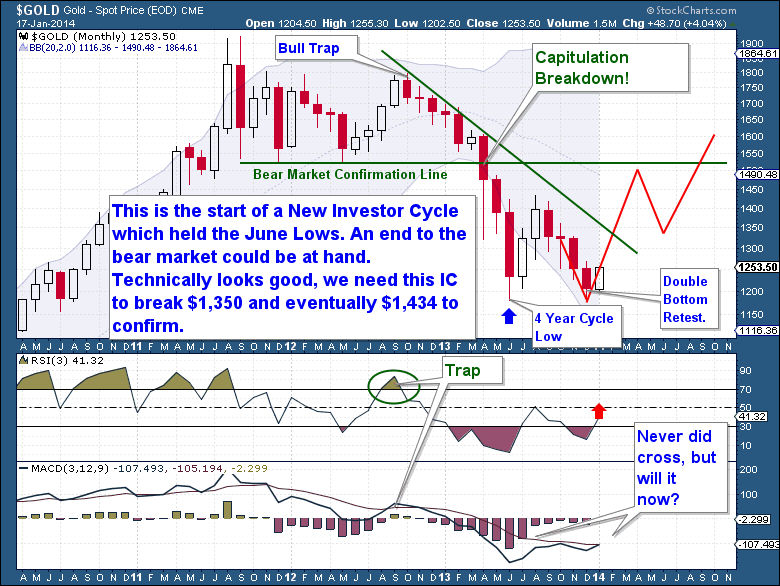
With gold holding the June Lows, an end to the bear market could be at hand. Technically, the long term Cycle looks ripe for a trend change. Once this current Investor Cycle breaks the $1,267 trend-line, we need it to follow through with a break $1,350 and eventually $1,434. That level represents a higher IC high, a break of the bear market trend-line, and a monthly Swing Low. It would not guarantee gold is headed back to new all-time highs, but it would be enough to support and confirm my earlier calls for a June bear market end.
The Financial Tap publishes two member reports per week, a weekly premium report and a midweek market update report. The reports cover the movements and trading opportunities of the Gold, S&P, Oil, and $USD Cycles. Along with these reports, members enjoy access to three different portfolios and trade alerts. As these portfolios trade on varying timeframes (from days, weeks, to months), there is a portfolio to suit all member preferences.
LIMITED TIME PROMOTION. You're just 1 minute away from profitable trades! please visit http://thefinancialtap.com/landing/try# AND ENTER PROMO CODE: 29off This will reduce ANY product by $29 (including the annual).