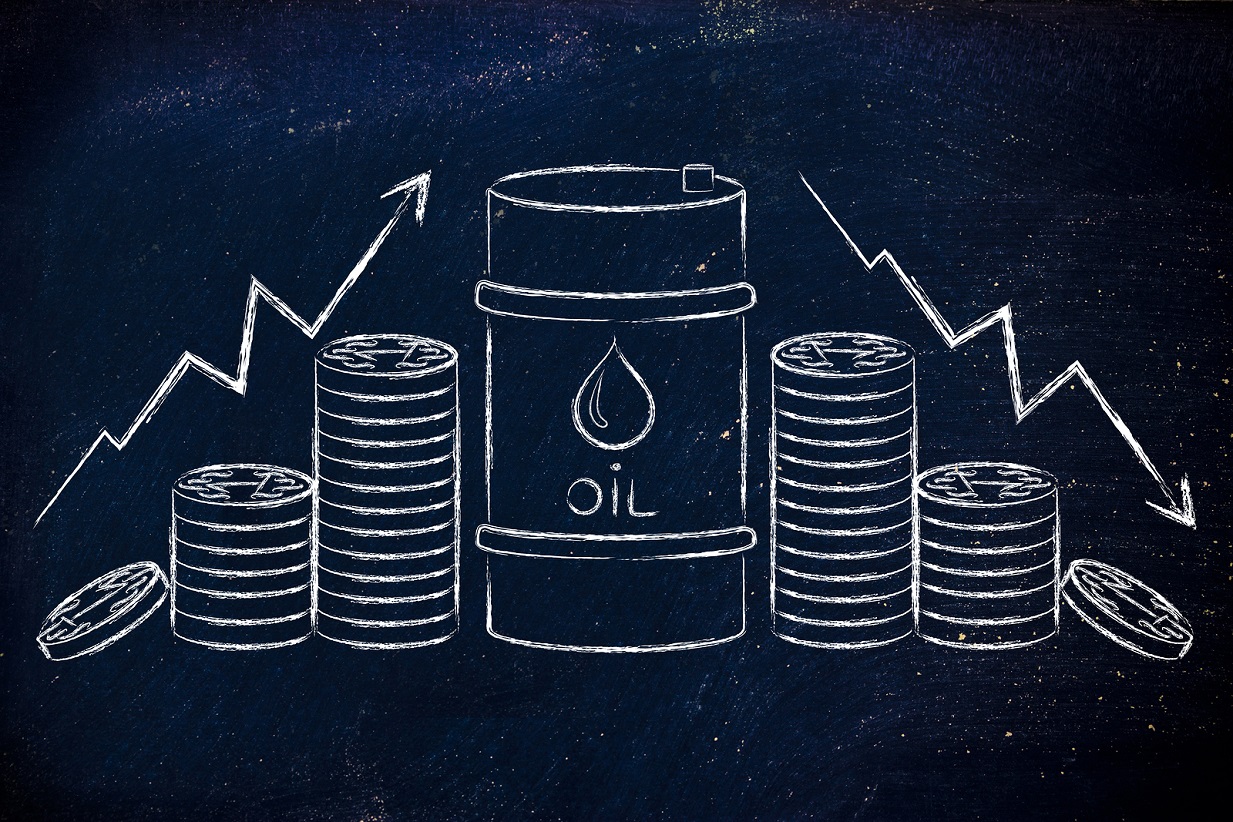
Excessive Crude Speculation
Excessive Crude Speculation
Crude has been on a fantastic run, and has gained 20% during just the first half of a single Daily Cycle. Unfortunately, however, we need to temper our enthusiasm, since Crude tends to move quickly during both up and down trending Cycles. And with the first half of the current Daily Cycle lining up with the rising portion of the Investor Cycle, the prolonged strength we’ve seen becomes easier to understand.
Macro news this week helped to fuel the current move by providing a catalyst for speculators to push their upside bets. Russia announced that it is considering joining OPEC, and that it’s open to the possibility of cutting oil production.
This announcement is almost certainly just talk designed to push up Crude’s price. Russia is not the collaborative type, and it certainly wants to maintain complete control over its natural resources. And with Russia currently pumping record amounts of Crude and its economy struggling for revenues and foreign reserves, it’s hard to imagine that Russia would consider such a move.
From a global economic standpoint, the macro data is poor, yet Oil is flowing faster than ever. Even with a fair-sized reduction in high cost US production, estimates have the world pumping 1.8 million barrels per day above current demand. And any price increases tend to quickly push a flood of additional Oil from high cost producers back onto the market.
In summary, the global supply/demand imbalance that led to the bear market has not corrected itself. Sure, higher cost Canadian and US production has decreased, but the declines have been offset by higher Russian, Libyan, and Iranian oil production. From a Cycles standpoint, we have little choice other than to assume that a cyclical bear market Cycle remains in control. By extension, all shorter Cycles should follow this bearish construct, and influence price significantly to the downside.

A huge number of bullish Crude Oil analyses have recently found their way into the popular press. It appears that many people believe that Crude’s lows are well behind it. As outlined above, I disagree completely, but the dynamic both reflects the speculative nature of the Crude market and explains the horrible picture that has developed in the COT report.
Crude Oil speculators are, once again, Long by nearly record amounts. This is the second largest speculative Long position in 30 years, giving you an idea on how quickly this market have become overheated. And on the flip side, commercial traders (smart money) have taken a significant Short position. These positions, in a bear market context, are evidence that the Crude market is fast approaching another significant top.

Too many people appear to be focused on the inverse head and shoulders bottom that has developed in Crude. While H&S patterns have their place, the problem with the current pattern is that for it develop and complete, Crude needs to be in a new cyclical bull market. I’m OK with a partial breakout – a solid punch above the below trend line – that acts as a bull trap, but that’s all that will make sense at this point. Crude Oil is structurally not ready to resume a bull market, and the macro-economic landscape simply does not align well with one. I believe that we’re seeing a bear market, counter-trend rally that is near exhaustion.

The Financial Tap – Premium
The Financial Tap publishes two member reports per week, a weekly premium report and a midweek market update report. The reports cover the movements and trading opportunities of the Gold, S&P, Oil, $USD, US Bond’s Cycles. Along with these reports, members enjoy access to two different portfolios and trade alerts. Both portfolios trade on varying time-frames (from days, weeks, to months), there is a portfolio to suit all member preferences.
NOTE: The Financial Tap offers you a Full 14 day, no risk, money back Trial. It’s just $99 thereafter for a full 3 months of membership, a fraction of what one stopped out trade is likely to cost you. Consider joining The Financial Tap and receive two reports per week and the education you need to become a better trader or investor See >> SIGN UP PAGE!

Bob.