The Show Goes On
This content is for members only


(Note: Our once only annual membership sale details at end of post)
After a long and relentless decline, the Crude market has finally enabled us to anchor its Cycles. Up until 2 weeks ago, Crude was locked in a clear crash Cycle, which made it impossible to expect anything other than a continuation of the crash. But now that Crude has reversed with a 20% rally, its moves are clearly the start of a new intermediate term Cycle.
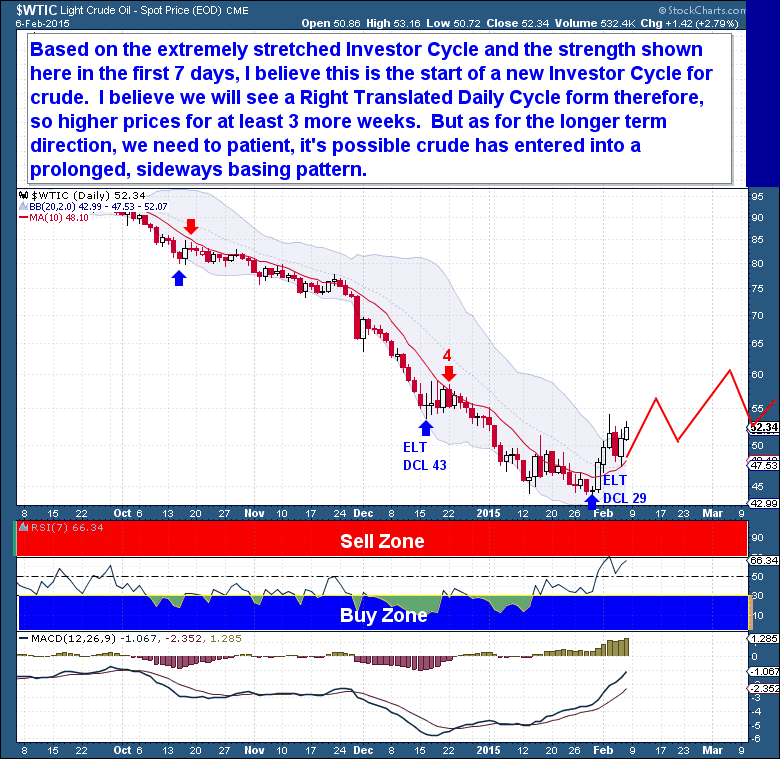
Based on the duration and the extreme nature of the recent Investor Cycle (IC) decline, Crude’s new-found strength is almost certainly the start of a new Investor Cycle. It’s impossible to know whether the current up-move will be only a counter-trend bounce, but because this is the 1st Daily Cycle of a new Investor Cycle, we should expect the current Cycle to be Right Translated (Meaning it will top beyond the midpoint of the Cycle).
On a longer time-frame though, I’m not convinced that the current 8 month downtrend has marked the bottom for Crude. The crash was supply-driven, and the underlying issue will take time to resolve. The genesis of the crash was excess investment in Crude production, which resulted in a supply glut that can only be solved through lower prices, over an extended period of time. Although the move down has been extreme, it’s a completely natural reaction to a significant supply/demand imbalance.
Three months of prices below production costs is not nearly enough time to have soaked up the current glut of supply. Oil firms have invested heavily in their production facilities, and want to be certain that the demand/supply dynamic is going to persist before shutting off production. And taking production offline is not immediate. It’s a lengthy process, with the decision to remove production leading market impacts by a significant length of time.
As with any bull market, Crude faces a situation where only time and repeated losses will cause participants to accept the market’s new reality. Any decision to close a facility is based primarily on expectations for longer term prices, and price expectations are always intensely biased to the upside at the end of a bull market. If Crude shows even a hint of a quick recovery in price, firms will be encouraged to “weather the storm”, only prolonging the extent and length of the decline.
So long as the massive stockpile of Crude inventory persists, lower production will not – in the short term – correct the imbalance. What’s required will be for facilities to close, production to fall, and enough time to pass for the existing inventory to be worked down. Unfortunately, I believe that the imbalance is structural, so it cannot and will not be corrected quickly on the demand side. Until we see supply better reflect the true demand for Crude, there is little prospect of a longer term recovery in price.

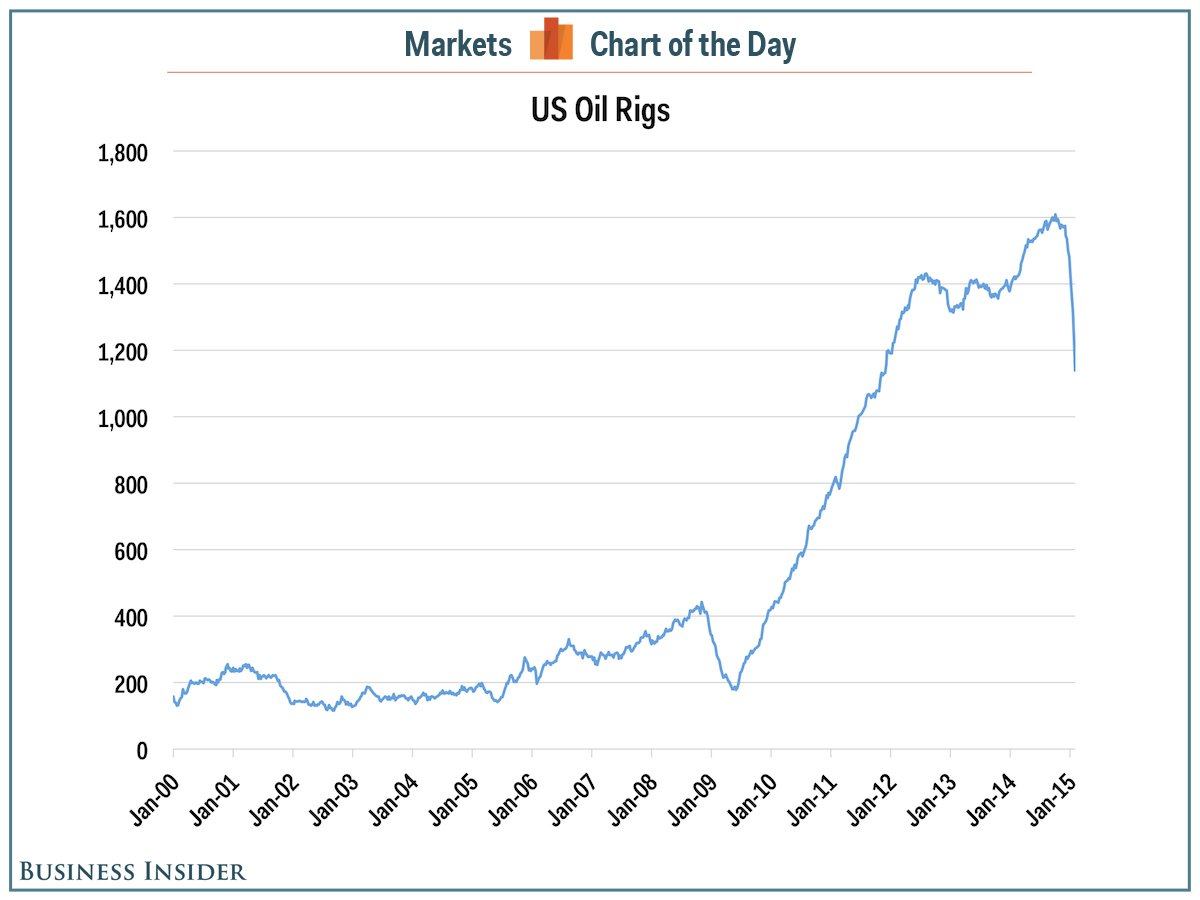
Bankruptcies and closures of Oil companies are underway, and this will help to reduce the supply imbalance. But this process will need much more time, possibly years, to play out. A look at the number of rigs in production makes it clear what led to the crash in prices. Between 2010 and 2014, there was massive over-investment in production, resulting in the addition of 4 million barrels of US Crude production per day. The result was the highest level of production in 30 years.
The current drop in rig counts has, so far, been about 30% from peak to trough. In past crashes, however, the rig count has declined by 50-60%. It takes time for any supply imbalance to work its way through the system because producers find it hard to shut down production. In some cases, producers even ramp up production in an attempt to compensate for the price declines. Netting it out, even with the recent price crash and rig closures, Energy Administration numbers show that the US still produces 9.19 million barrels of Crude per day, the most since 1983.
Given current production, any upside movement in Crude prices will likely be capped. During the past 5 years, Crude witnessed a huge boom and period of over-investment, and it will take longer than 7 months to correct the imbalance. I believe that the best the industry can hope for is that price recovers to the $60 to $70 level, where production is closer to its break-even point. That said, markets rarely work logically, and are typically drawn to the levels that will inflict the greatest pain on the most people in the shortest length of time.
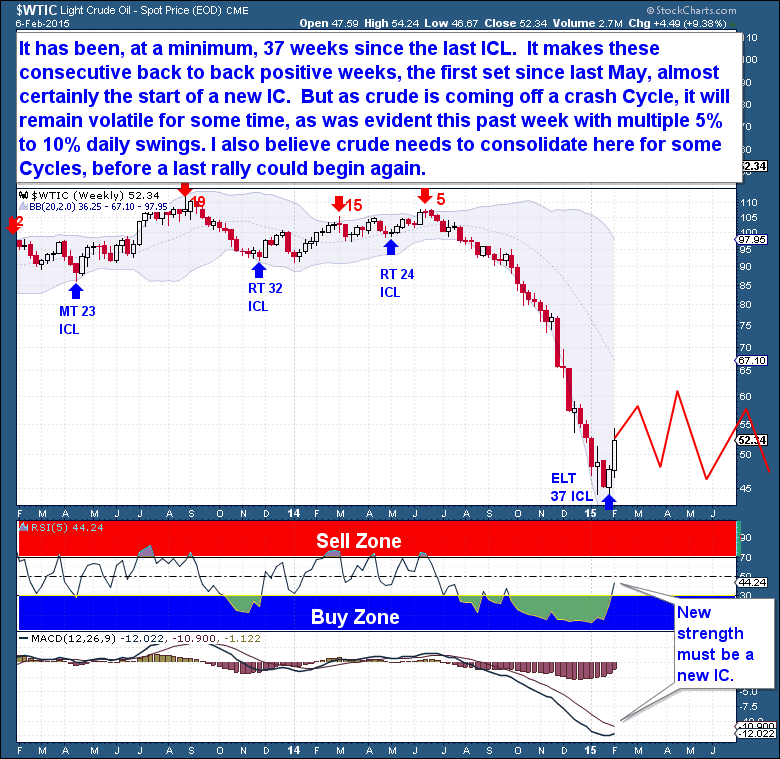
It has been a minimum of 37 weeks since the last Investor Cycle Low. This is one reason why back-to-back powerful weeks, the first such sequence since last May, signal the start of a new Investor Cycle. But with Crude coming out of a crash Cycle, price discovery will be difficult, and we should continue to see heightened volatility. To solve the over-production issue, I believe we’re going to need at least a year of depressed prices. If so, during the next 2 Investor Cycles (52 weeks), Crude prices should fluctuate between $40 and $60, with a real possibility of a drop below recent lows.
The Financial Tap publishes two member reports per week, a weekly premium report and a midweek market update report. The reports cover the movements and trading opportunities of the Gold, S&P, Oil, $USD, US Bond’s, and Natural Gas Cycles. Along with these reports, members enjoy access to two different portfolios and trade alerts. Both portfolios trade on varying time-frames (from days, weeks, to months), there is a portfolio to suit all member preferences.

An update to the Jan 15th post “A Cycle Test for Equity Markets” http://thefinancialtap.com/public/a-cycle-test-for-equity-markets
Until the ECB announcement of €1 trillion in QE, the equity markets were struggling to maintain their upside, near-vertical trajectory. The equity market Cycles seemed to have recently changed in character, and were at serious risk of rolling over and failing. And a failure at this point in the Investor Cycle, after such a massive and speculative bull market, would open the door to a significant decline and possibly even signal that the current great bull market was finally over.
But the ECB changed the game. It stepped on to the track and cleanly took the QE baton from the FED. At €60 billion per month until September 2016, the stimulus is massive, and we can’t discount the possibility that it will drive world markets higher until then. Since similarly-sized FED QE programs were credited with driving world equity markets higher, I see no reason why the ECB’s action will have a different outcome.
But, as stated many times before, eventually fundamentals always matter. And in this case, the action by the ECB, although significant, may be too late. With bond yields across Europe dipping into negative territory, my fear is that Europe may be already locked into a powerful deflationary cycle that is impossible to exit.
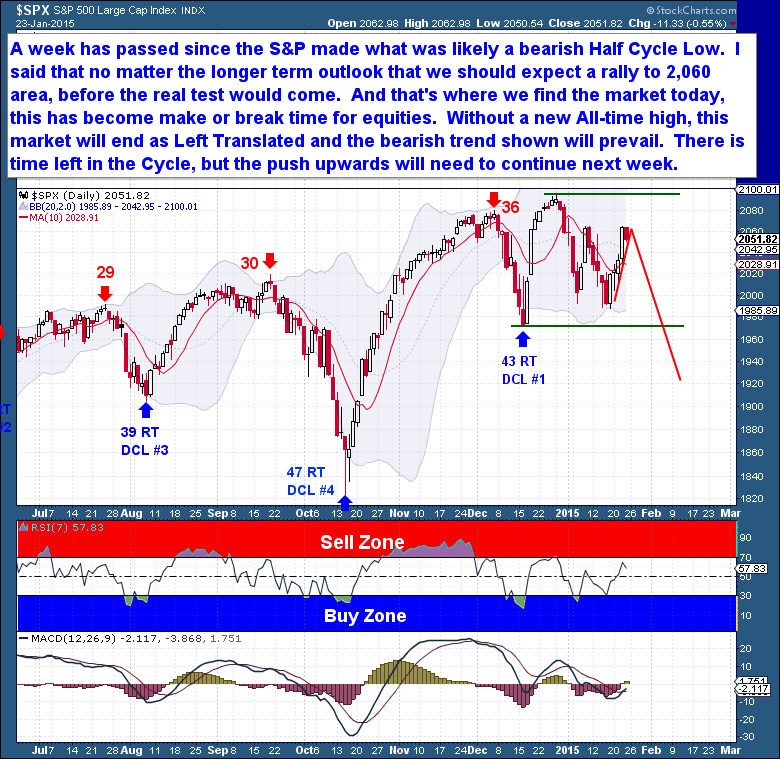
This idea brings us to the current Daily Cycle, and the importance of the “test” for equities that I’ve outlined recently. I made it clear last week that, regardless of the long term Cycle implications, I expected a rally in equities. And that’s what we got. The market has risen to the 2,060 area, the most likely point for a change in long term trend to present itself. The current DC is on Day 27, but the market has yet to exceed the high set on Day 8. If the market is topping, its current position is exactly where I would expect the rally to stall and fail as price turns lower.
So, this is it! I believe the longer term trend is coming down to the action over a handful of days! If, on the back of a €1 trillion QE program, the market cannot rally 45 points to a new all-time high, there is nothing that can save it. And if the market turns lower from here, it will print a Left Translated Daily Cycle (DC), and is likely to face a terrible and rapid sell-off. As I’ve been saying for some weeks, it’s up to the bulls to prove they want to keep the current rally alive.
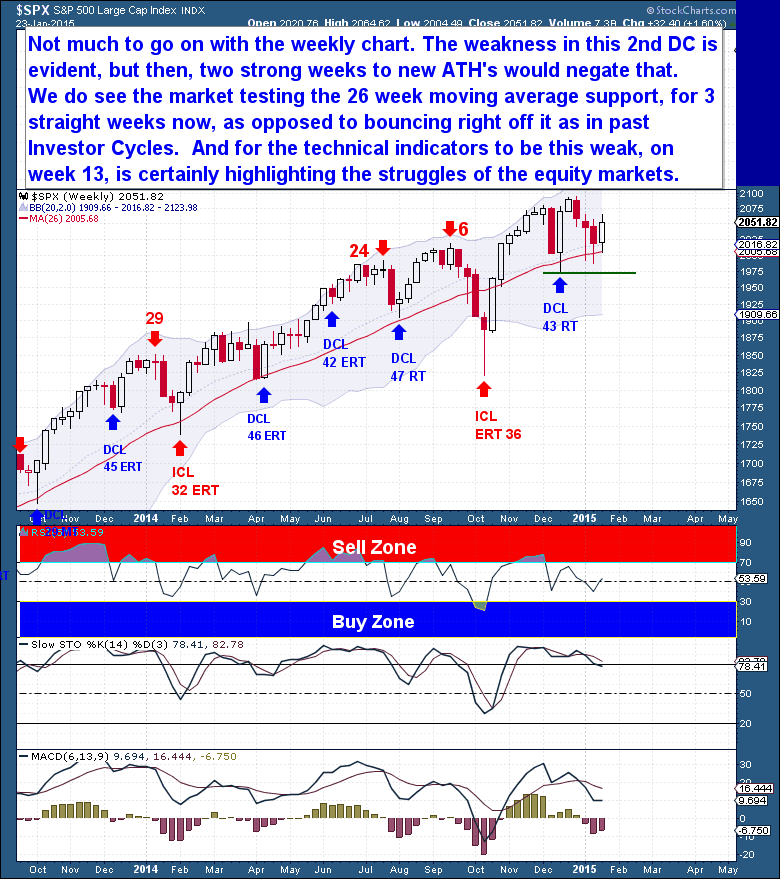
I believe that all the important moves will present themselves on the Daily Chart – the weekly chart (below) offers no additional insight. If we see a new all-time high in the coming weeks, it will negate the recent bearish behavior and open the possibility of another 200-300 point rally.
The weakness in the 2nd DC is evident on the weekly chart, with the market repeatedly testing the 26 week moving average support. In the past price would typically just bounce off the 26 wma and move higher, but this time the 26 wma is acting as resistance that could potentially give way. If the market fails to make new ATH’s, we will point to the current developments as evidence that the market was topping.
It should not be lost on anyone that this is the same analysis I presented in the Gold Cycle, but on the other side of the equation. The trend for equities is up, so we should expect a continuation. But as with Gold, there’s a lot of evidence that suggests that the long term trend might be changing. More importantly, we should see the potential for long term Gold and equity market trend changes as symbiotic. Equity market weakness and Gold relative strength are inextricably linked.