Posts
Gold Will Surprise In More Ways Than One
/in Public /by Bob LoukasEverywhere you turn today, gold is again being dismissed as a relic of the past, totally worthless, non-producing, with no place in any modern day portfolio. During the past 3 years, the gold complex has experienced the progressive stages of fear, capitulation, and despair, all classic bottoming phases of a long term Cycle. The question now is whether this high level of apathy is a symptom of a new secular bear market or a period of “stealth smart money” accumulation.
As an analysts of market Cycles, I’m encouraged by extremes in sentiment, as it correlates well with major Cycle turns. An asset’s price is just a reflection of the collective markets willingness to own it, so it naturally oscillates in response to changing sentiment, over a predictable period of time. Each ebb & flow of a Cycle may not repeat the last, but they sure do rhyme and they are as natural as breathing.
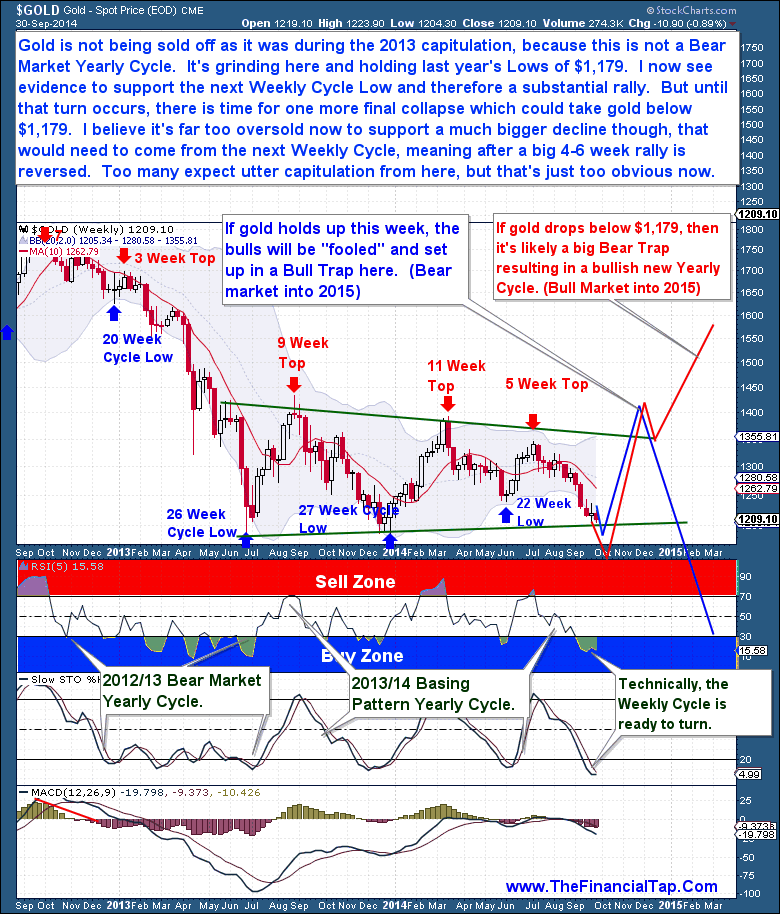
This brings us to the current Weekly Cycle, now standing at week 17 and in the early portion of the timing band for a Cycle Low. We know from experience that the final days of a Weekly Cycle can be thrilling; at times gold could lose $100 in the final 3 sessions. And that cannot be ruled out here, nobody can predict gold’s price movements over short periods of time. What we have is an asset that is in the timing band for a Daily and Weekly Cycle Low, sentiment at extremes, a COT report that is bullish, and miners that are showing relative strength. This is the very environment that spawns new Cycle rallies, not the setup for sustained declines.
I have been bearish for a while, for good reason, and I’ve been joined by most analysts of late as gold has fallen further. We’re seeing this reflected within extremely low (the 2nd Lowest of the past 15 years) sentiment numbers. Almost all financial analysts now expect to see a massive breakdown within the gold complex. And the recent Cycle failure and 4+ year lows within Silver has many expecting gold is just a step or two behind.
On the surface, this theory makes a lot of sense, the trend is lower. Gold is behaving in such a way that one can realistically expect a waterfall decline to quickly develop. But before we can entertain that idea, we must consider that this viewpoint has become a far too “scripted” notion. Setups that are so widely circulated and discussed, especially with sentiment at such levels, rarely ever develop that way.
To seriously consider a bear market continuation (from the 2011 top) or waterfall decline, we need to be aware that such developments require room (technically) and time (Cycle count) to transpire. In both cases, this is not an ideal position from which a significant gold sector breakdown could occur. The current deep Cycle count of the Yearly Cycle, the sentiment and technical readings, and even the U.S dollar’s massively stretched and overbought position do not support a sustained gold collapse.
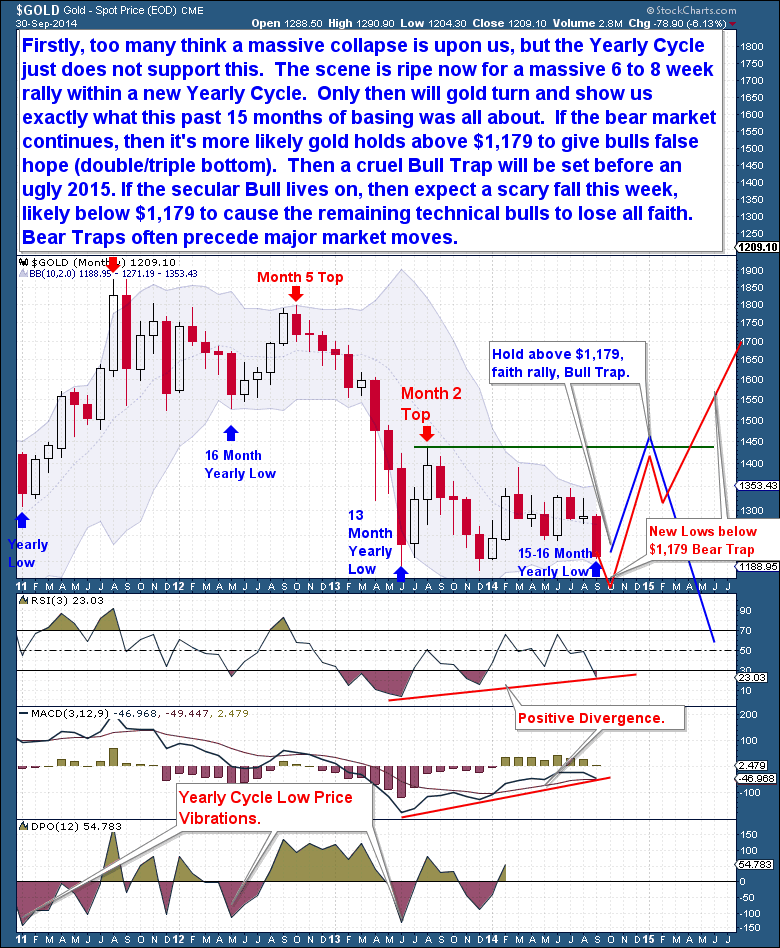
Instead, what we should consider and focus our energy on is the coming Yearly Cycle Low, rather than what is likely to occur in the coming week or two leading up to that low. This current 15 month basing pattern is obviously very important because it is the foundation from which the significant move will be based from. At this time, we don’t know if the that move will be a continuation pattern lower or the next leg higher. However in both cases, gold’s first surprise is that a significant Yearly Cycle rally is about to begin.
Notice how on the monthly chart above, the last 2 Yearly Cycles topped (red arrows) on month’s 4 and 2 respectively, that’s bear market behavior. Both were comfortably Left Translated, meaning that they topped early (Left of Center) and spent the most part of the Yearly Cycle in decline. But in each case, we still witnessed at least an 8 week rally to start each Cycle, in both cases adding at least $300 before topping. Yearly Cycle Lows occur only every 13 to 16 months and by definition coincide with the end of a (shorter) Weekly Cycle. What the evidence clearly shows is that we’ve come to another Weekly Cycle Low juncture, just as the Yearly Cycle is ready to turn here on Month 16.
The point here is that a (quick) loss of the $1,179, June 2013 lows within the next few weeks is a real possibility. But that reversal will mark the end and the beginning of a new Yearly Cycle. As shown earlier, even within a Bear Market, we see violent counter trend rallies; this coming Yearly Cycle rally should be no different. This rally will dominate the remainder of 2014 and take many people by surprise.
It won’t be until the 2nd or 3rd month of that rally that our next gold surprise will come. We will need to reconsider at that point whether this current 15 month Yearly Cycle basing pattern was just a continuation pattern (Bear Market) or a basing pattern (Bull Market) to support the next up-leg. It’s at the 2 to 4 month period where a bull or bear market will reveal itself again.
I could offer you an opinion as to where I believe gold is headed in 2015, but I see no point in making such brash predictions. My only concern is with where gold is headed in the intermediate future, that’s where the trade lies today. I will leave it to others who can do a much better job of entertaining you with lofty (biased) calls.
The Financial Tap publishes two member reports per week, a weekly premium report and a midweek market update report. The reports cover the movements and trading opportunities of the Gold, S&P, Oil, $USD, and US Bond Cycles. Along with these reports, members enjoy access to two different portfolios and trade alerts. Both portfolios trade on varying timeframes (from days, weeks, to months), there is a portfolio to suit all member preferences.
You’re just 1 minute away from profitable trades! please visit https://thefinancialtap.com/landing/try#


