Two week ago I first called for patience regarding Gold’s expected Investor Cycle (Investor Cycles run 24 weeks) decline. Since then, Gold has continued to chop sideways in a largely lifeless and apathetic manner. The few price spikes we've seen have typically come during thinly traded markets, with little follow-through and prices that close near where they opened.
The current price action is why the Bollinger Bands have constricted so tightly. The trading range has narrowed with each passing day, and volatility is now at an extreme low. The lack of volatility is reflected in the 2nd tightest set of Bollinger Bands since the start of the bull market 14 years ago. Regular readers will know that I place significant predictive value on instances where tight Bollinger Bands occur near expected Cycle pivots.
My current Gold analysis is beginning to sound repetitive, so I hope my call for patience will continue to be heard. The facts have not changed – Gold is in the timing band for a Daily Cycle Low (DCL), but has yet to complete a recognizable Cycle Low. Because moves out of tight Bollinger Bands are almost always fast and extreme, I expect that to happen this time as well. And the evidence continues to support the idea that the coming move will be sharply lower into a DCL.
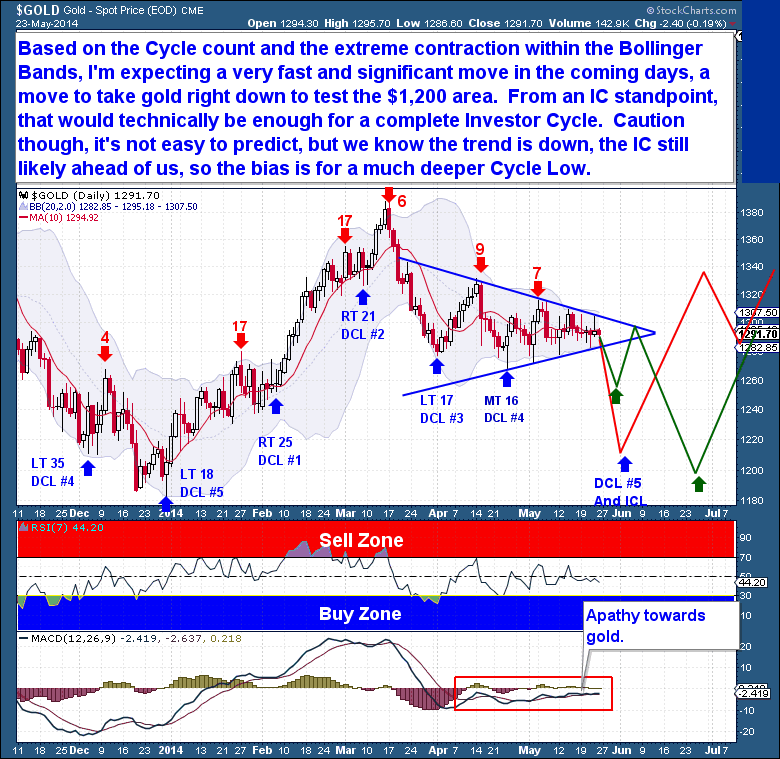
Even though we’re expecting a sharp decline, such a drop could be good news for Gold bulls. If the coming Daily Cycle Low holds above $1,179, it should be an extremely bullish event. Cycle Lows serve as important, sentiment clearing events, and are necessary if a sustained move higher is to follow. In addition, with Gold on week 21 of an Investor Cycle (which normally runs between 22-26 weeks), we could well be looking at an Investor Cycle Low at the same time, one which could also mark a significant turning point in Gold’s longer term outlook.
My goal has always been to assess asset price behavior in as unbiased a way as possible, focusing on the most probabilistic Cycle outcomes. But like any technical discipline, Cycles are not absolute; there is room for interpretation, and an allowance for alternative scenarios must be made. I don’t look to sensationalize my analyses, and they should not (and cannot) be presented in terms designed to give the illusion that they are foolproof. Cycle analysis is all about determining the most probable outcomes.
With Gold’s current setup, we’ve finally reached a significant Cycle pivot…and I believe that we are likely to be treated to a very surprising turn of events. Directly ahead is, I believe, a major turn and rally for Gold. I can’t be certain of the exact timing, since there exists the possibility of another Daily Cycle (in the current Investor Cycle) which could stretch into late June, but I need to reiterate my belief that Gold’s bear market ended last year, in June. To confirm that Gold's bear market is over, the coming Investor Cycle Low (ICL) will need to hold above the prior two ICLs ($1,179). If this plays out, the coming decline from tight Bollinger Bands should see the bears pile in on the short side, driving Gold's price toward the level of the last ICL. At some point, price should reverse sharply, trapping the bears and punishing them with a rally fueled by Short covering.
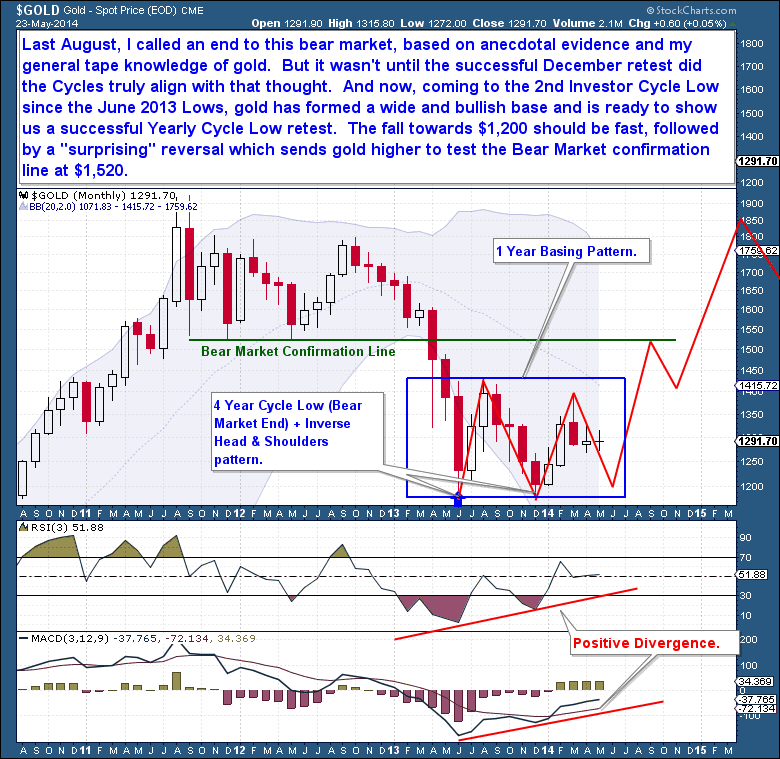
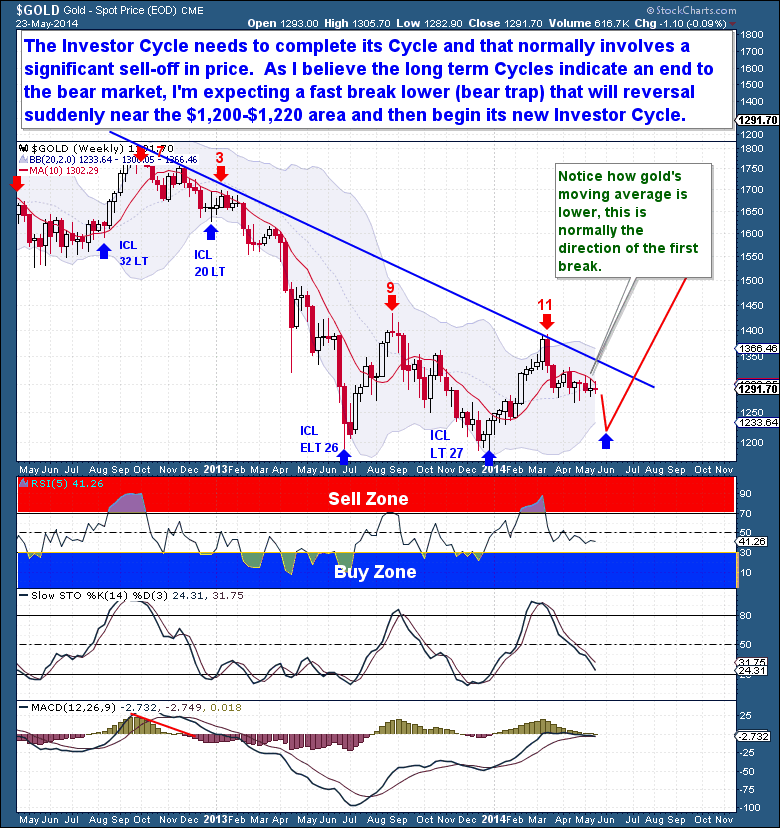 In August of last year, my call of an end to Gold's bear market was based both on anecdotal evidence and my experience reading the tape. But it wasn't until the successful retest of the low in December that Cycles truly supported the idea that a bottom was in. And now, with the approach of the 2nd ICL since the June 2013 bottom, Gold appears to have formed a wide and bullish foundation upon which the next bull market will be built.
The last Yearly Cycle Low occurred in June of 2013, making the coming YCL very important in confirming the end of the bear market. I expect that Gold will hold above $1,179, giving us both a 2nd straight Investor Cycle above the June 2013 Low and, more importantly, a successful retest of the last June's Yearly Cycle Low. If the retest is successful, Gold will have completed a very bullish inverse monthly H&S pattern, and a sharp counter-trend rally will be almost assured. Gold's moves out of Yearly Cycle Lows are often explosive, and there is no reason to expect that this time would be different. A new rally should be intense, and my expectation is for a move back to prior resistance around $1,520.
The Financial Tap publishes two member reports per week, a weekly premium report and a midweek market update report. The reports cover the movements and trading opportunities of the Gold, S&P, Oil, $USD, and US Bond Cycles. Along with these reports, members enjoy access to two different portfolios and trade alerts. As these portfolios trade on varying timeframes (from days to months), there is a portfolio to suit all member preferences.
LIMITED TIME PROMOTION. You're just 1 minute away from profitable trades! please visit https://thefinancialtap.com/landing/try# AND ENTER PROMO CODE: 29off This will reduce ANY product by $29 (including the annual).
Midweek Market Update – July 11th
/in Premium /by Bob LoukasYou don’t have access to view this content
A Faithless Rally
/in Public /by Bob LoukasAnother week has gone by with yet another all-time high. There has been no material change in either the long term outlook for equities or in FED policy, so one can be forgiven for being dumbfounded by the relentless march higher.
However, as I’ve said often during the past 12 months, the current move cannot be quantified. This is the tail-end of one of the strongest bull markets in history, and the forces at play are far too powerful and extreme to be rationalized with traditional metrics. The current move entered into a runaway phase long ago, and the final speculative blow-off is driving non-believers absolutely insane.
By non-believers, I refer to those who fail to understand that markets are often irrational. And that during the end of large cyclical moves, assets can be divorced from underlying fundamentals and can even behave in ways that almost seem counter to them. These extreme moves are self-fulfilling and relentless, and can cause even rational observers to raise the question of whether this time may be different. As humans, we quickly forget that all things in life, and especially in financial markets, move in distinct Cycles. How else is it possible to explain the FED missing some of the largest financial storms in history?
The current Daily Cycle has now matched my more optimistic forecast, set when the current DC began. And now, deep in the Daily Cycle (day 38) and very much overbought, equities should find it difficult to continue higher without some sort of short term consolidation. When I review the Daily Cycles from this past 2.5 year bull run, I can find only one other instance (41 days) where new highs were set this deep into a Cycle.
On Friday, the S&P closed above the Bollinger Band on day 38 while registering as extremely overbought. Although we can never rule out a few additional sessions higher, it is now likely that a turn down from the current top will ensue, bringing a rapid decline back to the 1,890 area. Because the current DC is already into the timing band for a DCL and the current move is speculative in nature, we should watch for heightened volatility and a sharp move lower during the next 5-7 sessions.
The DC path appears clear, but it is trickier to determine exactly what the Investor Cycle has ahead. Because the Yearly Cycle has gone parabolic and the markets are clearly irrational, the very idea of trying to pinpoint a specific outcome seems ludicrous.
But what we do know is this: because the current DC is so deep and overbought, the next move is likely to be lower. The strength and Extreme Right Translated nature of the current DC point to a shallow DCL, with the likelihood that the next DC exceeds the current high. The next Daily Cycle (likely the top of the current Yearly Cycle) will probably make an attempt at bettering the 2,000 level. I know this sounds far-fetched, but it also sounded that way when I proposed prices over 1,800 and then 1,900 many months ago. The current bull market should not be underestimated.
The Financial Tap publishes two member reports per week, a weekly premium report and a midweek market update report. The reports cover the movements and trading opportunities of the Gold, S&P, Oil, $USD, and US Bond Cycles. Along with these reports, members enjoy access to two different portfolios and trade alerts. Both portfolios trade on varying timeframes (from days, weeks, to months), there is a portfolio to suit all member preferences.
You’re just 1 minute away from profitable trades! please visit https://thefinancialtap.com/landing/try#
Not For The Faint Of Heart
/in Premium /by Bob LoukasYou don’t have access to view this content
Midweek Market Update – June 4th
/in Premium /by Bob LoukasYou don’t have access to view this content
Trust in the Trend
/in Premium /by Bob LoukasYou don’t have access to view this content
Midweek Market Update – May 28th
/in Premium /by Bob LoukasYou don’t have access to view this content
Laying Out The Traps
/in Public /by Bob LoukasTwo week ago I first called for patience regarding Gold’s expected Investor Cycle (Investor Cycles run 24 weeks) decline. Since then, Gold has continued to chop sideways in a largely lifeless and apathetic manner. The few price spikes we've seen have typically come during thinly traded markets, with little follow-through and prices that close near where they opened.
The current price action is why the Bollinger Bands have constricted so tightly. The trading range has narrowed with each passing day, and volatility is now at an extreme low. The lack of volatility is reflected in the 2nd tightest set of Bollinger Bands since the start of the bull market 14 years ago. Regular readers will know that I place significant predictive value on instances where tight Bollinger Bands occur near expected Cycle pivots.
My current Gold analysis is beginning to sound repetitive, so I hope my call for patience will continue to be heard. The facts have not changed – Gold is in the timing band for a Daily Cycle Low (DCL), but has yet to complete a recognizable Cycle Low. Because moves out of tight Bollinger Bands are almost always fast and extreme, I expect that to happen this time as well. And the evidence continues to support the idea that the coming move will be sharply lower into a DCL.
Even though we’re expecting a sharp decline, such a drop could be good news for Gold bulls. If the coming Daily Cycle Low holds above $1,179, it should be an extremely bullish event. Cycle Lows serve as important, sentiment clearing events, and are necessary if a sustained move higher is to follow. In addition, with Gold on week 21 of an Investor Cycle (which normally runs between 22-26 weeks), we could well be looking at an Investor Cycle Low at the same time, one which could also mark a significant turning point in Gold’s longer term outlook.
My goal has always been to assess asset price behavior in as unbiased a way as possible, focusing on the most probabilistic Cycle outcomes. But like any technical discipline, Cycles are not absolute; there is room for interpretation, and an allowance for alternative scenarios must be made. I don’t look to sensationalize my analyses, and they should not (and cannot) be presented in terms designed to give the illusion that they are foolproof. Cycle analysis is all about determining the most probable outcomes.
With Gold’s current setup, we’ve finally reached a significant Cycle pivot…and I believe that we are likely to be treated to a very surprising turn of events. Directly ahead is, I believe, a major turn and rally for Gold. I can’t be certain of the exact timing, since there exists the possibility of another Daily Cycle (in the current Investor Cycle) which could stretch into late June, but I need to reiterate my belief that Gold’s bear market ended last year, in June. To confirm that Gold's bear market is over, the coming Investor Cycle Low (ICL) will need to hold above the prior two ICLs ($1,179). If this plays out, the coming decline from tight Bollinger Bands should see the bears pile in on the short side, driving Gold's price toward the level of the last ICL. At some point, price should reverse sharply, trapping the bears and punishing them with a rally fueled by Short covering.
The last Yearly Cycle Low occurred in June of 2013, making the coming YCL very important in confirming the end of the bear market. I expect that Gold will hold above $1,179, giving us both a 2nd straight Investor Cycle above the June 2013 Low and, more importantly, a successful retest of the last June's Yearly Cycle Low. If the retest is successful, Gold will have completed a very bullish inverse monthly H&S pattern, and a sharp counter-trend rally will be almost assured. Gold's moves out of Yearly Cycle Lows are often explosive, and there is no reason to expect that this time would be different. A new rally should be intense, and my expectation is for a move back to prior resistance around $1,520.
The Financial Tap publishes two member reports per week, a weekly premium report and a midweek market update report. The reports cover the movements and trading opportunities of the Gold, S&P, Oil, $USD, and US Bond Cycles. Along with these reports, members enjoy access to two different portfolios and trade alerts. As these portfolios trade on varying timeframes (from days to months), there is a portfolio to suit all member preferences.
LIMITED TIME PROMOTION. You're just 1 minute away from profitable trades! please visit https://thefinancialtap.com/landing/try# AND ENTER PROMO CODE: 29off This will reduce ANY product by $29 (including the annual).
Follow the Yellow Brick Road
/in Premium /by Bob LoukasYou don’t have access to view this content
Midweek Market Update – May 21st
/in Premium /by Bob LoukasYou don’t have access to view this content
Shifting Sands
/in Premium /by Bob LoukasYou don’t have access to view this content