When we look at the current bull market in the context of prior bull markets, we’re immediately struck by the sheer size and strength of this move. Part of the strength comes from the deep generational selling event of 2008; just getting back to a reasonable valuation from such oversold levels represents a significant portion of the current bull market. The other driving force has been the FED, as its accommodative support has provided liquidity to the markets, and its Zero Interest Rate Policy has pushed yield-seeking money into equities from savings accounts and bonds.
At present, there are significant questions about the effectiveness of a continuation of the FED’s policies…at a time when the current bull market is “long in the tooth”. Although the lower and middle classes are generally much worse off than they were prior to the financial crisis, U.S corporations have rebounded and are now much leaner, with balance sheets that are in better shape than they were prior to the crisis.
But significant questions about future growth have emerged at a time when equity markets are pricing in a substantial macroeconomic recovery, including a return to blistering, double-digit growth. Although markets have climbed higher, mainstream consumers have been unable to participate in the “recovery”, so corporate earnings have languished at low single digit growth rates. In the face of tepid growth, already-rich market valuations have continued to rise. It’s these types of overbought, overextended, and overvalued conditions that have presaged the end of the great bull markets of the past.
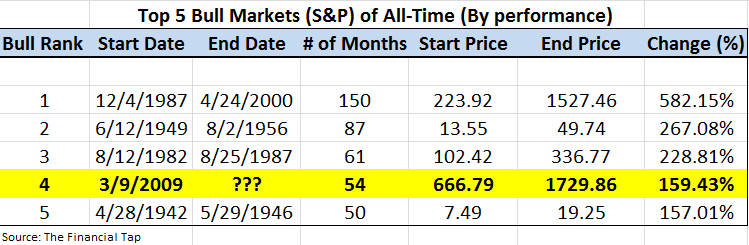
Below are the top 5 performing bull markets in history. Interestingly, and surprisingly, the current bull market is number 4 on the list. Upon closer examination, we see that the top 3 bull markets occurred as part of a general secular bull market. Meaning they were part of a period of true economic expansion, a period of real income growth and wealth creation. The current cyclical bull market, however, appears within a greater secular bear market, which makes this the best performing bull market (in terms of performance, not time) of any secular bear period in history. From a timing perspective, the 1970’s bull market (within a Bear Market) ran for 70+ months, while the 2002-2007 bull market (again within a Bear Market) was 55 months in duration.
 The point is, simply, that the current cyclical bull market, or 4 Year Cycle, is now extremely over-extended from both a performance and time standpoint. With an economy that continues to languish and a Yearly Cycle that is overdue for a significant decline, it’s difficult to expect that the current bull market will continue higher for another Yearly Cycle.
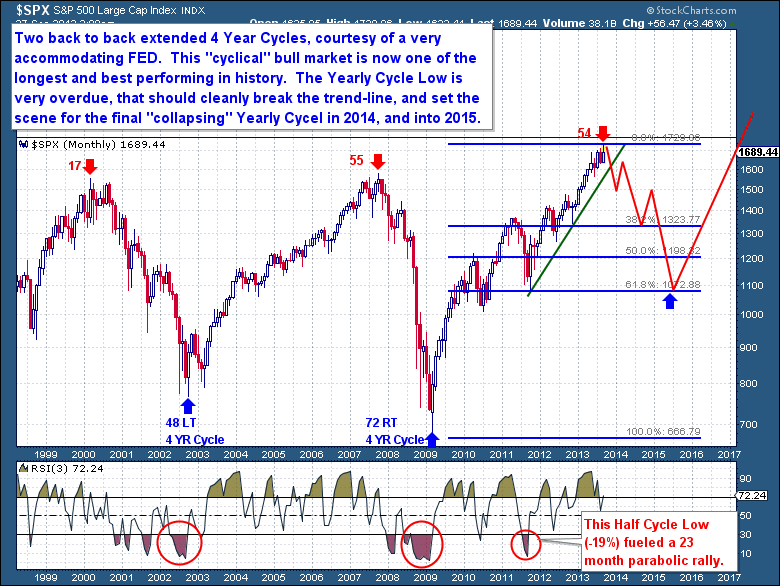
Courtesy of a very accommodative FED, we have two back-to-back extended 4 Year Cycles. Both cyclical bull markets were in the top 4 of the longest and best performing in history, but 13 years since the 2000 peak, the S&P is still only barely positive. From a real (inflation-adjusted) perspective, the markets are down over this 13 year period, and that’s at the end of the current bull with a peaking 4 Year Cycle.
The Financial Tap publishes two member reports per week, a weekly premium report and a midweek market update report. The reports cover the movements and trading opportunities of the Gold, S&P, Oil, and $USD Cycles. Along with these reports, members enjoy access to three different portfolios and trade alerts. As these portfolios trade on varying timeframes (from days, weeks, to months), there is a portfolio to suit all member preferences.
You're just 1 minute away from profitable trades! If you’re interested in learning more about The Financial Tap and the services offered, please visit https://thefinancialtap.com/landing/try#
Free Report – Complete the form below

Midweek Market Update
/in Premium /by Bob LoukasYou don’t have access to view this content.
Daily Cycle Trader
/in Public /by Bob LoukasThe Daily Cycle Trader portfolio went live 3 months ago and we’ve now closed out the first quarter. It’s been a hugely successful launch to this portfolio and I wanted to share some of the specific results of the portfolio with you:
Total Portfolio Return (3 months): 15.56%
Total Trades: 26
Winning Trades: 16
Winning Trade %: 61.5%
Avg Winning Trade Profit: 6.4%
Avg Losing Trade Loss: -3.1%
The Daily Cycle Trader portfolio is a consolidation of our shortest duration trades. With the Daily Cycle Trader, we expect to trade at Daily Cycle highs and lows. These Cycles generally occur every 18-25 days, so there will be relatively frequent trading. Daily Cycle trades will generally utilize ETFs and leveraged ETFs.
SPECIAL OFFER: If you would like to take advantage of this new Portfolio, please consider a membership; we now have Monthly, Quarterly, and Yearly options. To celebrate the launch of this new portfolio, we’re offering a $28.95 off coupon which could be used against any of the membership options. Apply it to a monthly membership, making the first month just $1. Or use it against our already discounted Quarterly and Yearly memberships.
To sign up, go to:
Membership Page
Use COUPON CODE: Trader (code is case sensitive). This will drop the price by $28.95.
Fearless
/in Premium /by Bob LoukasYou don’t have access to view this content.
Midweek Market Update Report
/in Premium /by Bob LoukasYou don’t have access to view this content.
Showdown Edition
/in Premium /by Bob LoukasYou don’t have access to view this content.
A Market Peak
/in Public /by Bob LoukasWhen we look at the current bull market in the context of prior bull markets, we’re immediately struck by the sheer size and strength of this move. Part of the strength comes from the deep generational selling event of 2008; just getting back to a reasonable valuation from such oversold levels represents a significant portion of the current bull market. The other driving force has been the FED, as its accommodative support has provided liquidity to the markets, and its Zero Interest Rate Policy has pushed yield-seeking money into equities from savings accounts and bonds.
At present, there are significant questions about the effectiveness of a continuation of the FED’s policies…at a time when the current bull market is “long in the tooth”. Although the lower and middle classes are generally much worse off than they were prior to the financial crisis, U.S corporations have rebounded and are now much leaner, with balance sheets that are in better shape than they were prior to the crisis.
But significant questions about future growth have emerged at a time when equity markets are pricing in a substantial macroeconomic recovery, including a return to blistering, double-digit growth. Although markets have climbed higher, mainstream consumers have been unable to participate in the “recovery”, so corporate earnings have languished at low single digit growth rates. In the face of tepid growth, already-rich market valuations have continued to rise. It’s these types of overbought, overextended, and overvalued conditions that have presaged the end of the great bull markets of the past.
Below are the top 5 performing bull markets in history. Interestingly, and surprisingly, the current bull market is number 4 on the list. Upon closer examination, we see that the top 3 bull markets occurred as part of a general secular bull market. Meaning they were part of a period of true economic expansion, a period of real income growth and wealth creation. The current cyclical bull market, however, appears within a greater secular bear market, which makes this the best performing bull market (in terms of performance, not time) of any secular bear period in history. From a timing perspective, the 1970’s bull market (within a Bear Market) ran for 70+ months, while the 2002-2007 bull market (again within a Bear Market) was 55 months in duration.
Courtesy of a very accommodative FED, we have two back-to-back extended 4 Year Cycles. Both cyclical bull markets were in the top 4 of the longest and best performing in history, but 13 years since the 2000 peak, the S&P is still only barely positive. From a real (inflation-adjusted) perspective, the markets are down over this 13 year period, and that’s at the end of the current bull with a peaking 4 Year Cycle.
The Financial Tap publishes two member reports per week, a weekly premium report and a midweek market update report. The reports cover the movements and trading opportunities of the Gold, S&P, Oil, and $USD Cycles. Along with these reports, members enjoy access to three different portfolios and trade alerts. As these portfolios trade on varying timeframes (from days, weeks, to months), there is a portfolio to suit all member preferences.
You're just 1 minute away from profitable trades! If you’re interested in learning more about The Financial Tap and the services offered, please visit https://thefinancialtap.com/landing/try#
Free Report – Complete the form below
Midweek Market Update
/in Premium /by Bob LoukasYou don’t have access to view this content.
Dollar Swan Dive
/in Premium /by Bob LoukasYou don’t have access to view this content.
The Final Run
/in Public /by Bob LoukasBack on August 29th, with the S&P on 1,644 and oversold, the bears were confident that it was finally going to be their time. But Cycle followers knew better, as the S&P was moving out of a deeply oversold Cycle Low and the trend was firmly still to the upside. That day I published this "Buy on Cannons" and called for an immediate rally back up to 1,710.
Of course since then, the equity markets went on to make new all-time highs, on the back of the FOMC announcement. That surge placed the S&P into deeply overbought territory, and the Cycle had quickly stretched far ahead of itself. So it has been no surprise to see weakness in the equity markets, I called for a Half Cycle drop last week (within the member reports) and now it’s progressing lower as we expected. It’s taken a nice little fall, yesterday being the first 5 consecutive day decline of 2013. But the reversal is likely in its closing stages now; it is after-all just a Half Cycle decline. Up to the close yesterday, the S&P had marked a 38.2% retracement of the Daily Cycle. Looking further below, the 50% retracement and 20dma level are down at the 1,680 mark, and that should provide a floor to this Half Cycle Low decline. Up until that 50% retracement level, this would remain a normal retracement of a very powerful Daily Cycle.
The coming bounce is going to reveal so much about this Investor and Yearly Cycle. This bounce should also be the final opportunity to make further all-time highs, for both this Daily and Investor Cycle. I believe any new high will mark the top of both Cycles, and from there it will be primarily down for another 1.5 Daily Cycles (60 trading days). As equities are well overdue to begin the decent into what promises to be a deep, corrective (at least -10%) Yearly Cycle Low, I have a suspicion that the coming bounce will fail to make new highs.
We’re headed for a showdown in Washington over government funding and raising the debt ceiling. Both parties are playing a dangerous game of cat and mouse with world markets, and they’ve now both boxed themselves into a corner. At this point, the rhetoric has been so heavy and passionate, that it will be hard for both parties to find any common ground which avoids looking as a defeat in the eyes of their constitutes.
I have little doubt it will end with some form of compromise, a last minute aversion of a crisis. But the anxiety and panic this will cause should be too much for the equity markets, as I believe this will be the ultimate catalyst for a significant fall into the Investor and Yearly Cycle Lows. Don’t get me wrong, this will not be the reason, rather simply a catalyst to accelerate the turning of a Cycle. A move towards a Yearly Cycle Low is inevitable.
The Financial Tap publishes two member reports per week, a weekly premium report and a midweek market update report. The reports cover the movements and trading opportunities of the Gold, S&P, Oil, and $USD Cycles. Along with these reports, members enjoy access to three different portfolios and trade alerts. As these portfolios trade on varying timeframes (from days, weeks, to months), there is a portfolio to suit all member preferences.
You're just 1 minute away from profitable trades! If you’re interested in learning more about The Financial Tap and the services offered, please visit https://thefinancialtap.com/landing/try#
Free Report – Complete the form below
Midweek Market Update
/in Premium /by Bob LoukasYou don’t have access to view this content.