
|
Cycle
|
Count
|
Observation
|
Outlook
|
Cycle Clarity
|
|
Daily
|
Day 19
|
Range 32-40 Days (1st Daily Cycle) |
Bullish
|
Green
|
|
Investor
|
Week 4
|
Range 20-24 Weeks
|
Bullish
|
Green
|
|
4 Year
|
Month 58
|
Range 48-52
|
Bearish
|
Green
|
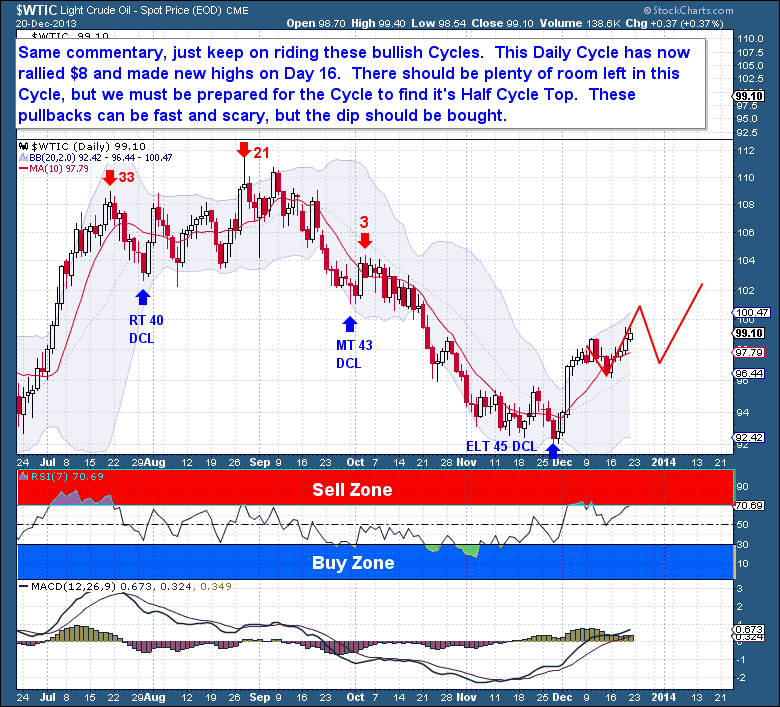
Crude is correlating very well with past bullish Right Translated Daily Cycles. This makes my job easier to perform, as I’m primarily laying out a framework that is based on past precedence. As an analyst and writer, it’s easy to overcomplicate what is a occurring within the Crude markets, all in the name of content generation. But the developments speak for themselves; this is simply a strong 1st Daily Cycle which is bouncing back from a fairly significant sell-off.
This Daily Cycle has now rallied $8 and made new highs on Day 16. That’s impressive, but there should be room left in this Cycle for further gains. It’s not all upside though; at some point over the next week we should be prepared for a Half Cycle Top. Once that temporary top is in, expect 3-5 days of declines before the next move higher begins. These pullbacks can be fast and scary, but the dip should be bought because we expect Right Translated (Top between day 25-32) Cycles in these situations.
The last time Crude oil was headed back down towards a major Cycle Low, back in October, I published the post “Crude Oil Headed Lower”. With that post I presented the below chart, outlining the most likely path Crude would take based on historical Cycles.
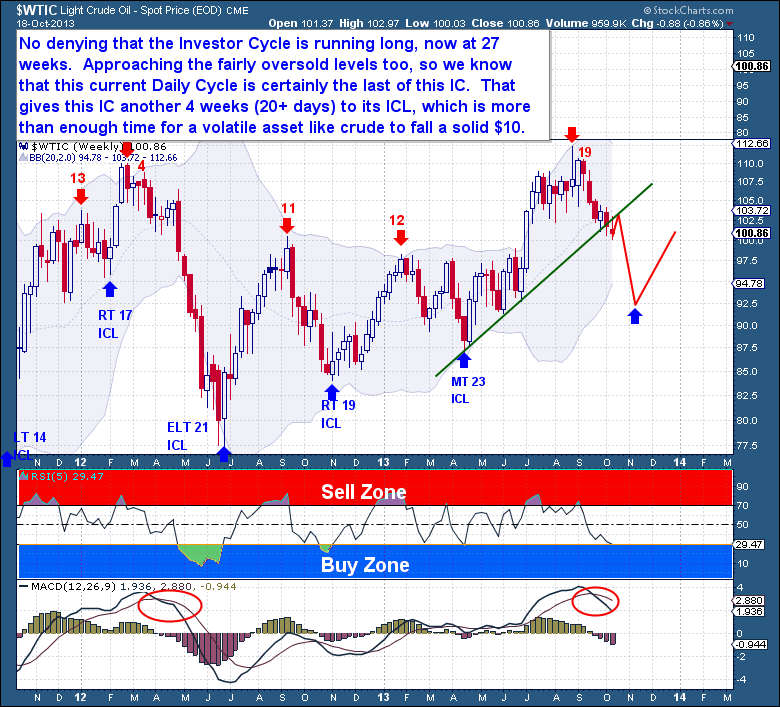
We were right on the price target and off by just 4 days with regards to expectations for a major low. That was a Cycles prediction which included a $15 decline over 8 weeks. For members that took that trade, it was obviously significant.
But along with that Cycle Low, we were able to enter into long positions as Crude pivoted out of the Investor Cycle Low. Such lows only occur twice per year and they’re always significant events. They’re often amazing buying opportunities for the longer inclined investors, especially when the predominant trend is to the upside. Fast forward a couple of months and below is the same chart (with same red prediction trend-lines as above) with today’s pricing.
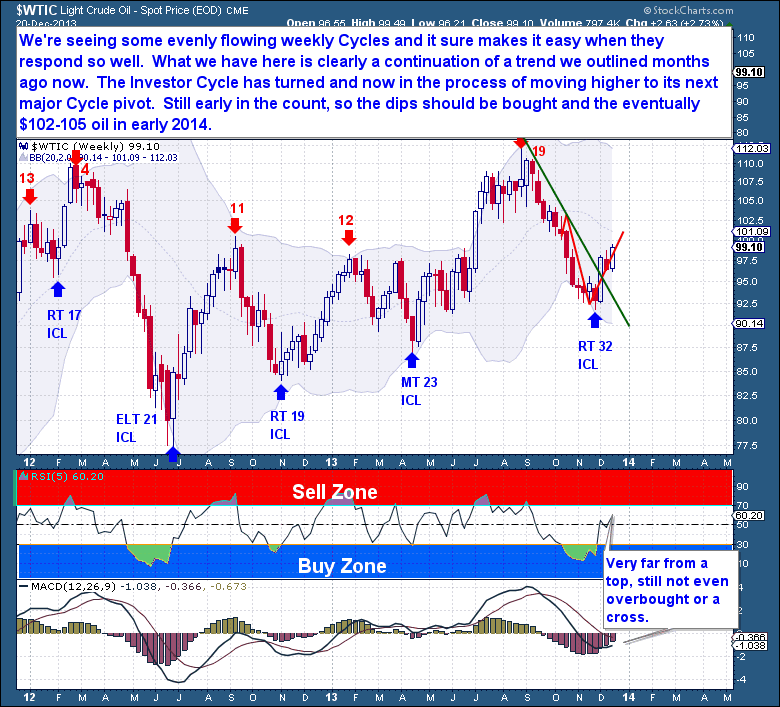
Notice the 4 week rally out of the Cycle Low; this is the benefit that Cycle’s analysis has provided us. We're seeing some evenly flowing weekly Cycles and this makes them easier to predict. On the weekly chart, we have a continuation of a trend we outlined months ago. The Investor Cycle has turned and is now in the process of moving higher to its next major Cycle pivot.
Any outcome is possible in the trading/investing sphere, but I'm much more confident with my expectation that Crude will eventually make it back to at least the $103-105 area within this Investor Cycle. As we shouldn’t expect a Cycle top before week 10, we’re looking at a rally into February. Sentiment remains fairly subdued and the Cycle count is far too early for us to be playing this cautiously.
The Financial Tap publishes two member reports per week, a weekly premium report and a midweek market update report. The reports cover the movements and trading opportunities of the Gold, S&P, Oil, and $USD Cycles. Along with these reports, members enjoy access to three different portfolios and trade alerts. As these portfolios trade on varying timeframes (from days, weeks, to months), there is a portfolio to suit all member preferences.
You're just 1 minute away from profitable trades! If you’re interested in learning more about The Financial Tap and the services offered, please visit https://thefinancialtap.com/landing/try#
Free Report – Complete the form below

Midweek Update
/in Premium /by Bob LoukasYou don’t have access to view this content.
If It Looks Like A Duck…
/in Premium /by Bob LoukasYou don’t have access to view this content.
Midweek Update
/in Premium /by Bob LoukasYou don’t have access to view this content.
Reckoning Day
/in Premium /by Bob LoukasYou don’t have access to view this content.
Weekend Report
/in Premium /by Bob LoukasYou don’t have access to view this content.
Crude Oil Headed “Higher”
/in Public /by Bob LoukasCycle
Count
Observation
Outlook
Cycle Clarity
Daily
Day 19
Bullish
Green
Investor
Week 4
Range 20-24 Weeks
Bullish
Green
4 Year
Month 58
Range 48-52
Bearish
Green
Crude is correlating very well with past bullish Right Translated Daily Cycles. This makes my job easier to perform, as I’m primarily laying out a framework that is based on past precedence. As an analyst and writer, it’s easy to overcomplicate what is a occurring within the Crude markets, all in the name of content generation. But the developments speak for themselves; this is simply a strong 1st Daily Cycle which is bouncing back from a fairly significant sell-off.
This Daily Cycle has now rallied $8 and made new highs on Day 16. That’s impressive, but there should be room left in this Cycle for further gains. It’s not all upside though; at some point over the next week we should be prepared for a Half Cycle Top. Once that temporary top is in, expect 3-5 days of declines before the next move higher begins. These pullbacks can be fast and scary, but the dip should be bought because we expect Right Translated (Top between day 25-32) Cycles in these situations.
The last time Crude oil was headed back down towards a major Cycle Low, back in October, I published the post “Crude Oil Headed Lower”. With that post I presented the below chart, outlining the most likely path Crude would take based on historical Cycles.
We were right on the price target and off by just 4 days with regards to expectations for a major low. That was a Cycles prediction which included a $15 decline over 8 weeks. For members that took that trade, it was obviously significant.
But along with that Cycle Low, we were able to enter into long positions as Crude pivoted out of the Investor Cycle Low. Such lows only occur twice per year and they’re always significant events. They’re often amazing buying opportunities for the longer inclined investors, especially when the predominant trend is to the upside. Fast forward a couple of months and below is the same chart (with same red prediction trend-lines as above) with today’s pricing.
Notice the 4 week rally out of the Cycle Low; this is the benefit that Cycle’s analysis has provided us. We're seeing some evenly flowing weekly Cycles and this makes them easier to predict. On the weekly chart, we have a continuation of a trend we outlined months ago. The Investor Cycle has turned and is now in the process of moving higher to its next major Cycle pivot.
Any outcome is possible in the trading/investing sphere, but I'm much more confident with my expectation that Crude will eventually make it back to at least the $103-105 area within this Investor Cycle. As we shouldn’t expect a Cycle top before week 10, we’re looking at a rally into February. Sentiment remains fairly subdued and the Cycle count is far too early for us to be playing this cautiously.
The Financial Tap publishes two member reports per week, a weekly premium report and a midweek market update report. The reports cover the movements and trading opportunities of the Gold, S&P, Oil, and $USD Cycles. Along with these reports, members enjoy access to three different portfolios and trade alerts. As these portfolios trade on varying timeframes (from days, weeks, to months), there is a portfolio to suit all member preferences.
You're just 1 minute away from profitable trades! If you’re interested in learning more about The Financial Tap and the services offered, please visit https://thefinancialtap.com/landing/try#
Free Report – Complete the form below
Brace for Impact
/in Premium /by Bob LoukasYou don’t have access to view this content.
Midweek Market Update
/in Premium /by Bob LoukasYou don’t have access to view this content.
Holiday Bliss
/in Premium /by Bob LoukasYou don’t have access to view this content.
Midweek Market Update
/in Premium /by Bob LoukasYou don’t have access to view this content.