Nearing a Market Peak
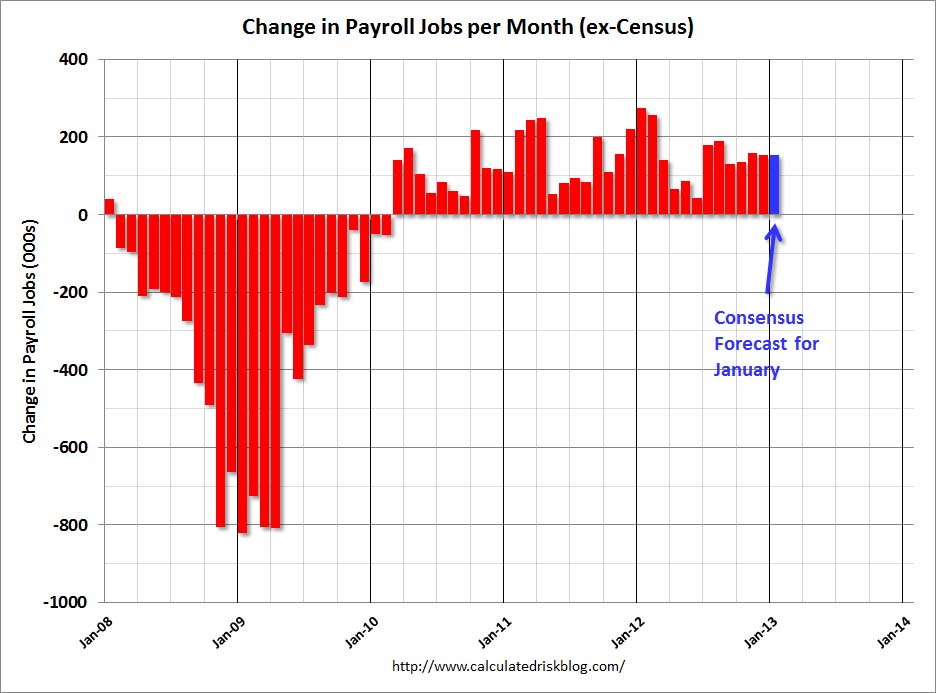
Yet again we’re told that Friday’s announcement that 195,000 jobs added in May were “solid numbers”. It’s funny what passes as solid these, this number in any past economic recovery would have been labeled as ordinary. Even so, behind these “solid gains” were plenty of reasons for concern. The number of people working part-time because they can’t find full-time jobs and the number who want jobs but have given up looking both jumped sharply. Because of this the U-6 rate jumped half a percent to 14.3%. This measure is much broader and it marked the biggest jump since 2009 and back to the highest level since February.
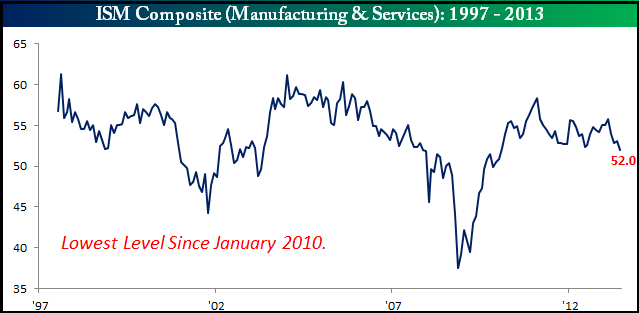
But employment is a lagging indicator and this week we also had a significant drop in the non-manufacturing ISM. We know that the manufacturing numbers have been weak for some time, so to see a decline in the more significant non-manufacturing (Services) ISM does not bode well for the economy. Looking at the composite of the two ISM indices (below) we see that both the recent and longer term trends are now down. Despite the FED’s trillions of liquidity, this business Cycle has clearly topped and is in the process of moving towards the next trough. That means a guaranteed print at some point below 50 (contraction) followed by an inevitable recession.
According to the National Bureau of Economic Research there have been 33 business Cycles since 1854 with an average Cycle length (trough to trough) of 56.2 months (4 year 8 months). Since 1945 we’ve seen 11 Cycles for an average length of 69.5 months (5 Year 9 months). The current business Cycle troughed in June of 2009 making this the 49th month of this Cycle, so we’re just 7 months away from the average Business Cycle Low. If we narrow the focus to just post WW2 Cycles, we’re 20 months away from the next Business Cycle Low. When you consider that most business Cycles spend up to a year contracting, we can appreciate just how far along this business Cycle is. That means a recession late 2013 and certainly by 2014 is very probable.
Of all the business Cycles since WW2, in terms of recovery and performance this one is easily the worst business Cycle. Despite that, the S&P 500 is up 150% from the 2007 lows, making this one of the best performing cyclical bull markets of the last 100 years. GDP was up just 2.4% (annualized) in the first half of this year, but still the equity markets had their best 6 month start to a year since 1998. Back in 1998 the bull market was in full steam with the economy growing over 5%, easily justifying the markets run-up as corporates were expanding earnings at a rapid rate.
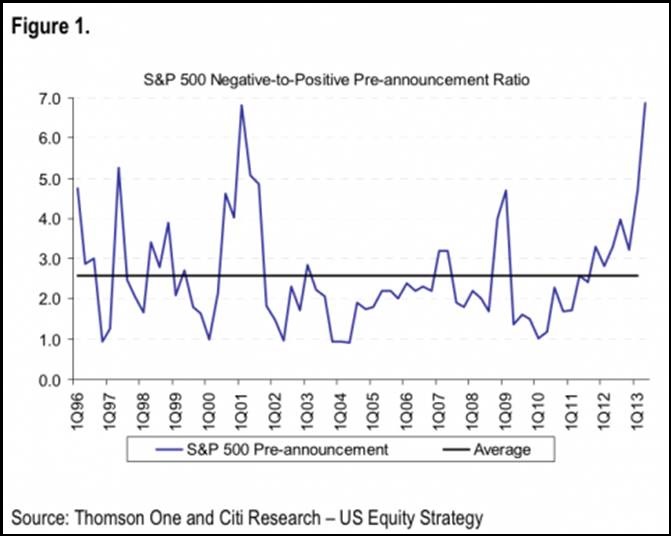
The anemic and slowing economy is why we’re witnessing an explosion of negative preannouncements this quarter. Of the 112 corporate Q2 preannouncements so far, 97 have been negative EPS warnings. The ratio (6.5) is now at the highest levels since the 2000 peak, having eclipsed the highs of the 2008 recession. Maybe it is different this time, corporations might be far less afraid to preannounce negative news. But I doubt it, margins peaked a long time ago and have been under pressure ever since. Revenue growth is proving to be an extremely difficult challenge as (real) personal incomes and aggregate demand both remain stagnant. Earnings came under significant pressure in Q1, and the coming bout of Q2 earnings might just be setting up the markets for a significant downside shock.
 The equity markets remain comfortably overvalued and overbought with sentiment still at elevated levels. With a slowing economy, this stretched and overbought 4 year Cycle is now coming up against additional headwinds of rising rates and $100+ oil. I believe we're knocking at the door of a major top now, but I don’t believe the markets made a cyclical bull market top with the recent May high. I believe that will come with a final fall surge out of a summer Investor Cycle Low. That top will mark the high of this 4 year Cycle and the end of this great cyclical bull market.
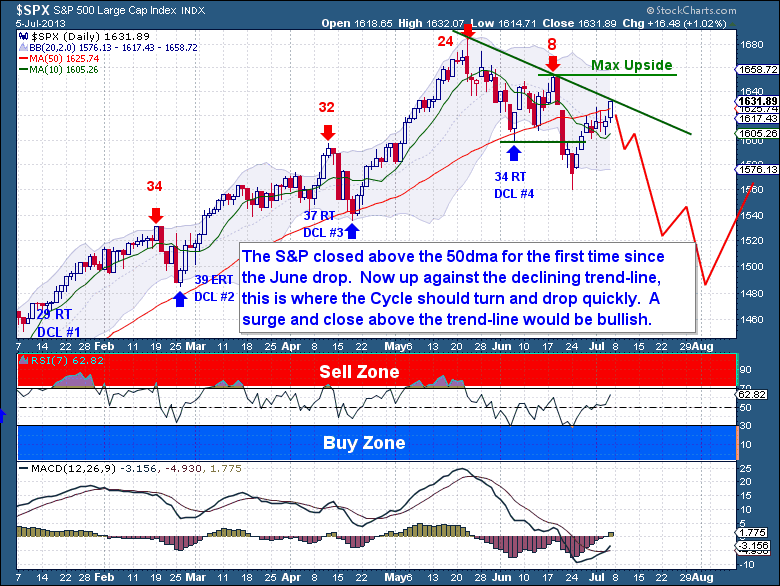
Focusing on the Daily Cycle and the immediate action, the S&P is back up against what is now an established down-trend line drawn from the May high. Typically during moves towards a Cycle Low these trend-lines act as solid resistance. Because this Daily Cycle is now on Day 21, the midpoint of an estimated 40 day Cycle, it remains my belief that the S&P is about to be turned down.
But there is some reason for the bears to be concerned now. The 50dma was regained on Friday and the MACD is showing a bullish cross-over. More importantly the normally leading Russell index just broke into new highs above 1,000. The question is, will the larger indices follow its lead or will the Russell move end up being one big bull trap. An upside trend-line break sure would be a win for the bulls, but it would be a little short of complete confirmation that we’re in a new Cycle. The ultimate line in the sand is the Day 8 Cycle high set on June 18th (1,654.19). Under no circumstances would a final Daily Cycle be making new Cycle highs 20+ days into a Cycle. If 1,654.19 is taken out then I would say the bulls are firmly back in control, that a new Investor Cycle was printed back on June 24th (1,560 low), and that a new all-time high above 1,700 will print this summer.
 But I stick firmly to my call that a deeper Cycle Low needs to be made. Call it consolidation of a massive 8 month rally, the need to retrace and backfill such a substantial move has yet to be full-filled. The standard retracement should see the S&P fall to at least 1,510, but a move to the 1,465-85 range would be in line with a majority of Investor Cycle Low retracements.
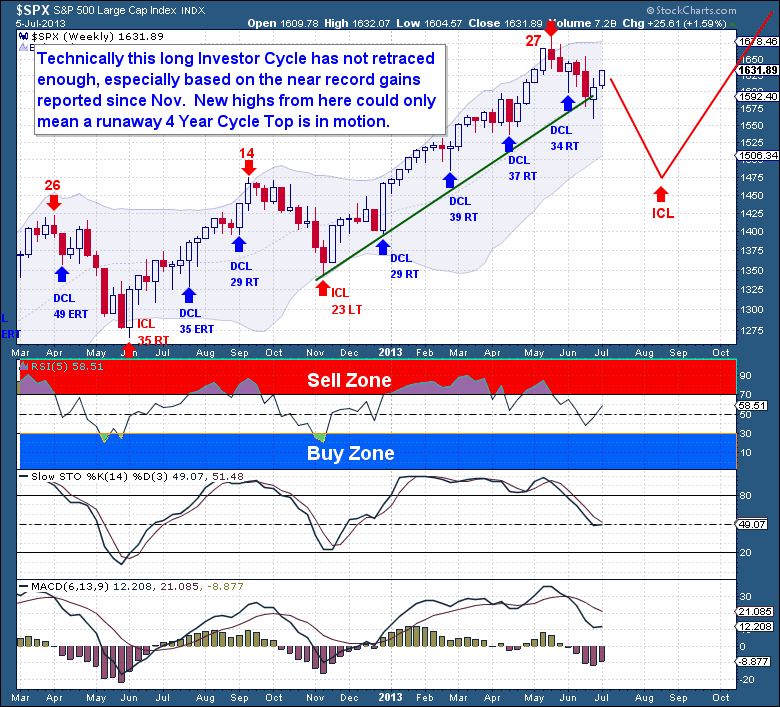 Once the drop gets going, it should be “fast and furious”. Within just 4 weeks we should see the equity markets shave over 100 more points off the index. Once a low is formed in August, it will spawn what should be the final rally into October and a big cyclical bull market top.
If you’re interested in learning more about The Financial Tap and the services offered, please visit https://thefinancialtap.com/about
