Markets in Turmoil – Private


Trading Summary

GoldNone

S&P –   None

Crude Oil – None

$USD –  None


Video Report

 In this video, I cover the standard Cycles of Gold, Equities, Crude, Dollar and Bitcoin, from a Daily and Weekly perspective.  See below the video for any charts or images I presented that might be of interest.  Also the Cycle counts, sentiment, COT blees rating are listed below the video.


Cycle Counts


Gold Cycle

Cycle Count Observation

Cycle Trend

Cycle Clarity

Daily Day 34 Range 24-28 Days Late Cycle  GREEN
Investor  Week 15 Range 22-26 Weeks Mid Cycle
GREEN

Supporting Indicators

Sentiment Level 77%
Bearish
Commitment of Traders (COT)
Blees Rating –  2
(Range 0 = Bearish 100 = Bullish)
Bearish COT picture


Primary Trend (Weekly Chart) UP Bullish – Bull Trend


S&P500

Cycle Count Observation

Cycle Position

Cycle Clarity

Daily Day 21 Range 38-44 Days Mid Cycle
Green
Investor Week 39 Range 26 Weeks Late Cycle
    Green

Supporting Indicators

Sentiment Level 33%
Very Bullish
Primary Trend (Weekly Chart) Up Bull Trend


CRUDE OIL

Cycle Count Observation

Cycle Position

Cycle Clarity

Daily Day 21 Range 36-42 Days  Mid Cycle Green
Investor Week 39 Range 22-26 Weeks Late Cycle Green

 Supporting Indicators

Sentiment Level 27%
 Bullish
Commitment of Traders (COT) Blees Rating (0-100) – 49 Neutral
Primary Trend (Weekly Chart) Down Post Crash.


$US DOLLAR

Cycle Count Observation

Cycle Position

Cycle Clarity

Daily Day 21 Range 15-20 Days Late Green
Investor Week 8 Range 16-20 Weeks Mid Green

 Supporting Indicators

Sentiment Level 50% Bearish
Primary Trend (Weekly Chart) UP Up-trend


Follow the Process – Public


Trading Summary

Gold – Short gold and miners

S&P –   None

Crude Oil – None

$USD –  None

Bitcoin –  Long Bitcoin


Video Report

 In this video, I cover the standard Cycles of Gold, Equities, Crude, Dollar and Bitcoin, from a Daily and Weekly perspective.  See below the video for any charts or images I presented that might be of interest.  Also the Cycle counts, sentiment, COT blees rating are listed below the video.


Gold Coverage – Minutes 0:00 – 18:25

Equities – Minutes 18:25- 29:40

Crude Oil – Minutes 29:40 – 35.22

US Dollar – Minutes 35.22 – 38:58

Bitcoin – 38:58 – End


Cycle Counts


Gold Cycle

Cycle Count Observation

Cycle Trend

Cycle Clarity

Daily Day 10 Range 24-28 Days Topped  GREEN
Investor  Week 20 Range 22-26 Weeks Topped
GREEN

Supporting Indicators

Sentiment Level 60%
Bearish
Commitment of Traders (COT)
Blees Rating –  9
(Range 0 = Bearish 100 = Bullish)
Bearish COT picture


Primary Trend (Weekly Chart) UP Bullish – New Bull Trend


S&P500

Cycle Count Observation

Cycle Position

Cycle Clarity

Daily Day 7 Range 38-44 Days New Cycle
Green
Investor Week 19 Range 26 Weeks Mid to Late Cycle
    Green

Supporting Indicators

Sentiment Level 48%
Bullish
Primary Trend (Weekly Chart) Up Bull Trend


CRUDE OIL

Cycle Count Observation

Cycle Position

Cycle Clarity

Daily Day 7 Range 36-42 Days Early Cycle Green
Investor Week 19 Range 22-26 Weeks Mid to Late Cycle Green

 Supporting Indicators

Sentiment Level 35%
 Bullish
Commitment of Traders (COT) Blees Rating (0-100) – 80 Bullish
Primary Trend (Weekly Chart) Down Post Crash.


$US DOLLAR

Cycle Count Observation

Cycle Position

Cycle Clarity

Daily Day 7 Range 15-20 Days Topped – Failed.
GREEN
Investor Week 16 Range 16-20 Weeks  Late Cycle
GREEN

 Supporting Indicators

Sentiment Level 56% Neutral
Primary Trend (Weekly Chart) UP Up-trend


A Spill in the Making – Free Report


Premium Report published on October 2nd, 2016


Gold Cycle

Cycle Counts


Cycle Count Observation

Cycle Position

Cycle Clarity

Daily Day 21 Range 24-28 Days – 2nd Daily Cycle Topped
 Green
Investor Week 18 Range 22-26 Weeks Topped
     Green

Supporting Indicators

Sentiment Level 58%
Above Average (Bearish)
Commitment of Traders (COT) Blees Rating – 15 (0-100) Bearish
Primary Trend (Weekly Chart) Up Bull Trend

The Gold market continues to be lethargic.  2 weeks ago, negative rumblings about Deutsche Bank pushed Gold higher out of the Half Cycle Low.  But the move quickly stalled and reversed, ensuring that the current Daily Cycle would remain Left Translated.

Gold’s current sluggishness is not unexpected, however.  18 weeks into any Investor Cycle should see sellers largely controlling the action, and I’d expect that to be the case with Gold until it finds an ICL.


10-3-gold-daily

Considering the advanced age of the IC, it’s impressive how well Gold has held up.  And it’s a boost to bulls that the Miners and Silver are following suit with relative strength of their own.  The broader precious metals complex appears to be consolidating its massive gains from early 2016 via time, rather than price, and that’s decidedly long term bullish.

The Miners, in particular, provide a case in point.  GDX rose 120% in 6 months to start 2016, and in the 2 months since topping have retraced a relatively meager 20%.  I’ve discussed the volatility of the Miners frequently, so readers will know that such relative strength during a move into an ICL is extremely bullish for the intermediate and longer terms.


10-3-gdx-weekly

It’s easiest to see the Gold’s bullish consolidation via time on the Investor Cycle chart.  Gold topped 12 weeks ago and has a failed Daily Cycle behind it, yet is down only $70 from the IC peak.  It’s a classic bull market consolidation of the huge six-month rally, and is a significant change in character from what we all lived through during Gold’s bear market.

A turn higher is on the way, make no mistake about it, but we may need to be patient as we wait for it.  Gold could need another full Daily Cycle lower before finding its ICL, and that would mean another 4-5 weeks of declines.  Rest assured, however, that the bull market trend is firmly established.  During the next series of higher IC’s, I expect the general public to again pay attention to Gold.


10-3-gold-weekly


Investor Cycle Trading Strategy

Reserved for Premium Members only.  See https://thefinancialtap.com/ for membership details.


Daily Cycle Trader Strategy

Reserved for Premium Members only.  See https://thefinancialtap.com/ for membership details.


Portfolio Positions Summary

Open Positions – Investor Portfolio –

Reserved for Premium Members only.  See https://thefinancialtap.com/ for membership details.


Open Positions – Daily Cycle Trader Portfolio –


None.


Equities (S&P500)

Cycle Counts

Cycle Count Observation

Cycle Position

Cycle Clarity

Daily Day 21 Range 36-42 Days – 2nd Daily Cycle  Near Mid Cycle
 Green
Investor Week 15 Range 22-26 Weeks Mid Cycle Rally 
     Green

Supporting Indicators

Sentiment Level 61%
Elevated
Commitment of Traders (COT) NA
Primary Trend (Weekly Chart) Up Bull Trend Established

Although equities have remained largely range-bound, there appears to be some short-term hesitation in the markets.  That’s not necessarily a sign that the market has topped, but is more a reflection of uncertainty in the environment brought on by powerful cross currents that are washing through the markets.  More specifically, the FED is looking to raise rates (at the wrong time), and the presidential candidates offer distinctly different visions for economic and trade policies.

I don’t believe the market is currently leaning strongly in either direction.  And there are no technical signs, nor any analysis, that decisively shifts the argument.  So rather than trying to bet on which way the market will break, a more prudent course is to focus on how to react to either possibility – a break higher or a break lower.


10-3-equities-daily

What we do know is that a break higher would result in equities hitting a new all-time high.  And any market breaking to an all-time high in a new IC is almost certainly in a bull market – and giving traders ample reason to be Long.  So despite the uncertain economic environment and equities’ poor fundamentals, a breakout here would give a good reason for upside exposure.

The same argument holds true for a breakdown.  A break below the September Low would signal a failed Daily Cycle, and would confirm a week-7 IC top and a Left Translated IC.  If a failed DC were to happen, I believe an aggressive Short position would be warranted.


10-3-equities-weekly


Investor Cycle Trading Strategy

No positions at present.  With Cycle timing approaching the midpoint for an IC, and with price at a crossroads, there is no logical play on the intermediate timeframe.  Taking a position at present, Short or Long, is a 50/50 proposition.  As outlined above, until the S&P moves past either of the two price points that signal a break to the upside or a breakdown, the setup won’t offer an edge.


Daily Cycle Trader Strategy

No positions at present.


Portfolio Positions Summary


Open Position – Investor Portfolio –

Reserved for Premium Members only.  See https://thefinancialtap.com/ for membership details.


Open Position – Daily Cycle Trader –

Reserved for Premium Members only.  See https://thefinancialtap.com/ for membership details.


CRUDE OIL

Cycle Counts

Cycle Count Observation

Cycle Position

Cycle Clarity

Daily Day 9 Range 36-42 Days (2nd DC)   Towards Half Cycle Top  Green
Investor Week 9 Range 22-26 Weeks IC Rally
Green

 Supporting Indicators

Sentiment Level 42%
Pessimistic (Bullish)
Commitment of Traders (COT) Blees Rating (0-100) – 36 Bearish  (Up this week).
Primary Trend (Weekly Chart) Down Bear Market Trend

OPEC made some bullish announcements this week, which lifted the price of Crude Oil.  Even so, experience suggests that OPEC will have little ability to manage Oil prices going forward; it’s members are too dependent on Oil revenues to cut output significantly for any length of time.  In addition, many are in desperate economic positions, so it’s unlikely that any OPEC members will restrain production.  They have consistently demonstrated that they are incapable of taking short term pain (by cutting production) to achieve higher prices over the long term.

This week’s announcements, however, did help to push Crude into a new Daily Cycle uptrend.  And since it’s still early in the Investor Cycle, further short term upside is probable.  I believe, however, that price is unlikely to exceed the high of Aug 19th, leaving us with a double top and another Left Translated Daily Cycle.


10-3-crude-daily


Investor Portfolio Trading Strategy

No trades at present, but an opportunity to Short Crude has arrived.   A Swing High near the current level will provide a good entry, while the Aug 19th high (with some cushion) is a good place for a Stop.


Daily Cycle Trader Strategy

No trades at present.  If Crude has a capitulation selloff next week, I will consider a Long scalp trade after a closing Swing Low.  For this to be an option, I’d like to see Crude drop below $43.


Portfolio Positions Summary

Open Positions – Investor Cycle Portfolio –

Reserved for Premium Members only.  See https://thefinancialtap.com/ for membership details.

Open Positions – Daily Cycle Trader Portfolio –

Reserved for Premium Members only.  See https://thefinancialtap.com/ for membership details.


$US DOLLAR

Cycle Counts

Cycle Count Observation

Cycle Position

Cycle Clarity

Daily Day 31 Range 18-22 Days – (DC #4)
Green
Investor Week 22 Range 18-22 Weeks Topped
Green

 Supporting Indicators

Sentiment Level 49% Elevated (Bearish)
Commitment of Traders (COT) Blees Rating – 89 (0-100) Bullish.
Primary Trend (Weekly Chart) Flat Neutral

This week, the Dollar continued its recent range-bound action, and has still not shown any sign of a DCL.  I am not sure that we’ll see a trend develop in the Dollar until either the November election or the FED moves on interest rates.

Even though it’s stuck in a range, the Dollar has seemed “heavy”, pushed downward by advanced Cycle timing on the weekly chart.  A DCL is due soon, so I expect a breakdown from the current wedge in the very near-term


10-3dollar-daily


Investor Cycle Trading Strategy

No trades at present.


Daily Cycle Trader Strategy

No trades at present.


Portfolio Positions Summary

Investor Cycle Portfolio –

None.

Daily Cycle Trader Portfolio –

None.


U.S Bonds

Cycle Counts


Cycle Count Observation

Cycle Position

Cycle Clarity

Daily Day 12 Range 20-26 Days – (DC#1 or #4) New DC
 Green
Investor Week 3 or 23 Range 22-26 Weeks Last DC or start of New DC
     AMBER

 Supporting Indicators

Sentiment Level 68% Elevated (Bearish) – But nice drop
Commitment of Traders (COT)  NA
Primary Trend (Weekly Chart) Uptrend Bull Market

Bonds enjoyed a sharp, 9-day snapback rally that erased most of the losses from the last Daily Cycle decline.  But the snapback rally has now reversed lower, leaving price atop the 10 dma.  Until this point, Bonds have behaved as we’d expect in any Daily Cycle; how they move from here will be determined by the larger Investor Cycle.

At this point, we don’t know whether the last DCL also marked an ICL.  In my opinion, however, the selloff into the last DCL was nowhere near large enough to reset sky-high sentiment and also mark a weekly Cycle Low.  So Bonds are at a point of uncertainty.  If they are in the final DC of the IC, price should break below the 10 dma in the coming week.  From there, the selling should intensify, and we could see significant declines leading into the November elections.

On the other hand, if the current DC is the first of a new, surprise IC, then Bonds will have likely found support at the 10-day moving average before heading higher again.  New, short-term highs will be followed in the coming months by a series of higher highs and a clear uptrend.


10-3-bonds-daily


Investor Cycle Trading Strategy

No trades at present.


Daily Cycle Trader Strategy

No trades at present.


Portfolio Positions Summary


Investor Portfolio –

None


Daily Cycle Trader Portfolio –

None


(Reprint) A note on trading:

I have received several e-mails recently asking why I haven’t taken various trades when good setups appeared to be present.  I appreciate the question, and have a couple of thoughts that I’d like to share.

A primary goal of this service has always been to help Members develop a personal trading style.  I can be definitive when I think a setup warrants a trade, but each Member needs to evaluate the analyses I present – Cycle, technical and Sentiment – in terms of his individual risk tolerance and determine whether a setup make sense to him.  Not all of us will see trade setups the same way.

Cycles can be a powerful tool in trading, and I share my trades as a way to let Members know when I’m personally ready to “pull the trigger”.  But The Financial Tap was never intended to be a trading service that directs Members to take multiple trades a week with the promise of spectacular gains if they do so.  Rather, my intention has always been to provide tools that help Members to learn to make their own decisions about trading.

As an example, a longtime Member with whom I frequently exchange e-mails has developed a successful trading style that combines a setup (a high probability that a Cycle has bottomed/topped) with trade triggers (a combination of MACD, StochRSI and ADX indicators).  He executes a trade when his triggers have all crossed higher/lower, but only after my Cycle analysis shows a strong probability that a Cycle has bottomed/topped.  Another Member I know takes a more conservative approach, and sells Put options when different indices (SPY, IWM, GDX, GLD, SLV) appear to be bottoming – again based on my Cycle and Sentiment analysis.

Each Member should actively work to develop and refine his own trading style, using my Cycle and Sentiment work as a jumping off point.  And don’t hesitate to reach out to me with questions or comments – they help me to better support you.

Bob

Forgot to Buy the Dip – (FREE)


Premium Report published on June 19th, 2016


Gold Cycle

Cycle Counts


Cycle Count Observation

Cycle Position

Cycle Clarity

Daily Day 14 Range 24-28 Days – 1st Daily Cycle Possible 2nd Half Cycle Rally
 Green
Investor Week 3 Range 22-26 Weeks New Cycle Rally
     Green

Supporting Indicators

Sentiment Level 74% (Up 12%)
Elevated (Bearish)
Commitment of Traders (COT) Blees Rating – 0 (0-100) Bearish (Worsened by 18)
Primary Trend (Weekly Chart) Down – (Possible Change) Bull Trend

This week, Gold continued to rally impressively out of its June Low, confirming a new Investor Cycle is underway. And with the new IC at only week 3, Gold should see many weeks higher before the IC tops.  If the Right Translated ICs during Gold’s 2001-2011 bull market are a guide, the new IC promises to deliver terrific performance.

Gold’s Daily Cycle was interesting this week.  It had rallied for 9 of 10 sessions and was far extended to the upside when, on Thursday, it was hit with a significant reversal.  Even though Gold was ripe for profit taking, I believe that the reversal was exacerbated by panicked investors with new or leveraged positions.  But after Thursday’s drop, Gold again roared higher to end the week and, importantly, close above $1,300.  While Gold’s intermediate term bullish position is undeniable, Thursday’s drop may not have been severe enough to relieve the asset’s overbought status.  I believe that another drop into a Half Cycle Low is likely early next week.

6-18 gold daily

Out of the HCL, we should see Gold continue to rally.  The current DC is on day 14, and a normal 1st DC would suggest that Gold will move higher until day 20, or beyond, before it tops and heads into a DCL.  But because Gold appears to be in the early stage of a new Cyclical bull market, the top of the current 1st Daily Cycle may not come until day 25-30.  So Gold could easily see another 3 weeks higher before a meaningful selloff occurs.

In recent weeks, I’ve mentioned Gold likely being in a new cyclical bull market, and it’s an important enough issue that it makes sense to review my rationale.  First, Gold recently completed a powerful, Right Translated Investor Cycle.  And with a higher IC High and a higher IC Low firmly in place, a change in trend has been confirmed.  In addition, the precious metals Miners have doubled in price off the bottom, and holdings in the GLD ETF have skyrocketed, a sure sign that asset managers are desperate to obtain exposure.  And if these data points were not enough, speculative interest in Gold has exploded, with trading volumes in various CME precious metals products up 50-100% from last year’s levels.

6-18 gold volume

On the weekly chart, a powerful new trend has been established.  The chart is both bullish and well-constructed, and speaks to the power of the cyclical advance that’s underway.   Even though many investors waited on the sidelines for real evidence that the bear market was over, Gold rallied quickly to a new, 2-year high.

It’s possible that Gold has run a little too far too quickly – it surged this week outside of the top Bollinger Band.  At this point, members should be careful in their leverage, and also mindful not to be suckered into adding exposure at the wrong time – like after a sustained rally.  Excess leverage should be harvested after all mini-rallies, and slowly added back after good 2-3 day pullbacks.

Unbelievably, I’ve seen people lose money in bull markets.  They have over-extended themselves at the tail-end of mini rallies, only to capitulate and sell for a loss during profit-taking retrenchments.  To be successful, traders should stay strong, be content with their positions, and add on dips.

6-18 gold weekly


Investor Cycle Trading Strategy

I want to reiterate my belief that everyone should hold a solid, long-term position in both bullion and the Miners, positions that are being held for the long term and not traded with the Cycles.

In terms of trading, I still hold my Long position, and it is doing well.  This is a new IC, so I do not plan to trade the position during any upcoming Daily Cycle fluctuations.  This trade should be active for another 2-3 months.


Daily Cycle Trader Strategy

I am holding two GLD and one AGQ position, so have decent exposure here.  I will look to close all 3 positions after any good rally near days 19-25.


Portfolio Positions Summary

Open Positions – Investor Portfolio –

30% Long position in GLD.  Stops set to $114.50

20% Long Positon in SLV.  Stops set at $15.55

Open Positions – Daily Cycle Trader Portfolio –

Long Two positions GLD – Stops set top $115.55

Long one position in AGQ @ $40.33 Stop $37.72


Equities (S&P500)

Cycle Counts

Cycle Count Observation

Cycle Position

Cycle Clarity

Daily Day 22 Range 36-42 Days – 3rd Daily Cycle Likely formed HCL
 Green
Investor Week 22 Range 22-26 Weeks Possibly Topped
     Green

Supporting Indicators

Sentiment Level 61% (Down 2%)
Extremely Elevated
Commitment of Traders (COT) NA
Primary Trend (Weekly Chart) Flat- (Possible Change to Down) Neutral to Bearish

During the past few years, we’ve seen plenty of sharp sell-offs in equities that have reversed to make new highs, but this time the sell-off feels different.  I sense that the market’s character has changed on multiple timeframes.  That said, I’m keeping my eye on the recent S&P high at 2,120.55.  It’s just shy of the all-time high, and if the S&P rises above it, a big new all-time high is likely to follow.

This week’s equity selloff was accompanied by an unusually big move in the VIX (fear) index.  And in a clear sign of market distress, world sovereign debt markets rallied sharply, as capital moved from equities into the most defensive of asset classes.  Such desperate bids to own debt at 0 or even negative interest rates, tells me where the smart money wants to be invested.

The decline this week was expected.  It was deeper than I thought it would be, but the timing (day 19) for a move into a Half Cycle Low was perfect.  The market tried to rally on Friday and failed, although I believe that during the coming week, the S&P will recover to retrace at least half of its recent decline.

6-18 equities daily

Surprisingly, sentiment has remained significantly elevated.  Bull market conditioning has left far too many people believing that equities will see another big rally in the near future.  I don’t think that’s at all likely.

For the past 2-3 years, the market has not been driven by fundamentals.  Earning grew until 2014 and kept the market at least somewhat satisfied.  But now, with earnings and revenues both having peaked 2 years ago, and with the age of the expansion at 7 years, the economy has almost certainly peaked for this Business Cycle.  Its next move should be toward the trough (recession).


6-18 earnings versus index

Fundamentals were an afterthought while earnings were increasing.  But now that earnings have turned lower, all eyes are on the FED.  Only easy money from the FED’s printing press can sustain a market at historical overvaluation.

The FED’s recent policy focus has been on ZIRP (Zero Interest Rate Policy), yet it is clear from the chart below that ZIRP alone cannot lift the market higher.  We’ve had a zero interest rate environment for 8 years, and to expect a new stock market breakout from a continuation of ZIRP is ludicrous.

The markets are running dry of liquidity again and only a new round of quantitative easing (QE4) can get equities going again.  It’s my view that there are only a couple of events that could lead the FED to embark on QE4: a) the market takes a massive dive, or b) the economy turns decisively lower.


6-18 Equity markets and QE

We are left with an Investor Cycle that stalled near the S&P’s all-time high.  The market has spent nearly two years in the current topping range, and now that the current IC is at a typical topping point, I expect the coming Daily Cycle rally will quickly reverse lower.

In summary: perceived risk for equities should continue to rise, volatility should increase, and a summer selloff should begin shortly.


6-18 equities weekly


Investor Cycle Trading Strategy

I’m still Short with a sizable position.  Unless something significant changes, I will remain patient and let the position work.


Daily Cycle Trader Strategy

I am currently Short 2 positions, and will be closely watching next week’s expected rally out of the Half Cycle Low.  If the rally falters quickly, I’ll look for the Daily Cycle to make a lower low.


Portfolio Positions Summary

Open Position – Investor Portfolio –

40% Short the S&P 500 via the ETF – SDS.  Bought at $20.33 and $18.76  STOP $17.26

Open Position – Daily Cycle Trader –

Two positions short the S&P 500 via the ETF – SDS.  Bought at $18.85  STOP $17.50


CRUDE OIL

Cycle Counts

Cycle Count Observation

Cycle Position

Cycle Clarity

Daily Day 13 Range 36-42 Days (3rd Daily Cycle) Formed HCL, new rally
 Green
Investor Week 19 Range 22-26 Weeks Timing for top/decline Green

 Supporting Indicators

Sentiment Level 42% (Down 4%)
Flat to Slightly elevated
Commitment of Traders (COT) Blees Rating – 19 (0-100) Extremely Bearish- (+2).
Primary Trend (Weekly Chart) Down Bear Market Trend

Crude was under pressure this past week, and quickly gave back 10% of its recent gains.  In addition, it has left us with a conflicting Cycle count.  Although Thursday’s decline appears to be a Daily Cycle Low, it came on day 52, well past the normal timing band for a low.

The timing question is significant.  I believe that the smaller drop on day 40 (perfectly timed for a DCL), could well be the DCL instead of the day 52 low.  In addition, the day 40 drop corresponds with movements in the equity markets.  If the DCL occurred on day 40, Crude’s new DC is now in a failed state.  Maybe it is just my bearish bias, but I believe that Crude Oil is more than overdue for a turn lower.

6-18 crude daily

I have similar bearish expectations from the weekly chart: I believe it is time for the IC to turn lower.  Since Crude is still early in its bear market, the rise in the current IC should by now have run its course.  When price briefly exceeded the last IC high a few sessions ago, the top created a classic bear trap.  And now, a break below the rising trend-line appears imminent.

 6-18 crude weekly


Investor Portfolio Trading Strategy

I have been considering a Short trade for some time, and will look for an entry opportunity this week.


Daily Cycle Trader Strategy

I was looking for a potential Short trade, but was mindful of Crude’s volatility.  Crude Oil is not a market than can be played defensively.  Successful trading generally requires that timing be perfect and Stops be wider than normal.


Portfolio Positions Summary

Open Positions – Investor Cycle Portfolio –

None.

Open Positions – Daily Cycle Trader Portfolio –

None.


$US DOLLAR

Cycle Counts

Cycle Count Observation

Cycle Position

Cycle Clarity

Daily Day 8 Range 18-22 Days – (DC #2) Seeking HCL
Green
Investor Week 7 Range 18-22 Weeks Early to Mid Cycle Rally
Green

 Supporting Indicators

Sentiment Level 45% (Up 5%)
Slightly Pessimistic (Bullish)
Commitment of Traders (COT) Blees Rating – 100 (0-100) Extremely Bullish (+)
Primary Trend (Weekly Chart) Flat Neutral

We’re not seeing the same strength in the Dollar’s 2nd Daily Cycle that we saw in its 1st.  The FED’s recent backtracking on the possibility of future rate increases was undoubtedly a catalyst, and was joined by evidence that the economy is not moving at an acceptable level.

Over time, the Dollar has been elevated versus other major currencies.  The primary reason for this seems to be the idea that the FED has been ahead of other central banks when it comes to monetary policy.  The Dollar’s recent weak price action speaks to a potential change in that belief.

6-18 dollar daily

A lack of upside follow-through is becoming evident on the weekly chart.  Although it’s still early in the Investor Cycle, so far, the Dollar has failed to show the potential to break out sharply to the upside.


6-18 dollar weekly


Investor Cycle Trading Strategy

No trades at present.


Daily Cycle Trader Strategy

No trades at present.


Portfolio Positions Summary

Investor Cycle Portfolio –

None.

Daily Cycle Trader Portfolio –

None.


U.S Bonds

Cycle Counts

Cycle Count Observation

Cycle Position

Cycle Clarity

Daily Day 13 Range 20-26 Days – (DC#?) Topped for HC, Seeking HCL
 Green
Investor Week 8 Range 22-26 Weeks Cycle Rally
     Green

 Supporting Indicators

Sentiment Level 74% (Up 20%)
Elevated (Bearish)
Commitment of Traders (COT)  NA
Primary Trend (Weekly Chart) Uptrend Bull Market

The Bond market has launched into another massive rally.  Some of the move is speculative, with traders pushing the entire asset class higher across all maturity timeframes.  But a bigger part of the move is defensive in nature, fueled by a massive rush out of risk markets toward the relative safety of the Treasury and Bond markets.

I am not at all surprised by the move.  After all, a large cup-and-handle pattern has been developing for some months on the weekly chart.  But the current move higher is, I believe, only a sample of what is yet to come.  In the short term, however, the rise has pushed Bonds to being way too overbought, and I expect them to see a modest pullback.


6-18 bonds daily

To better appreciate the breadth of the current rally, the below charts show how indiscriminately Bonds are being bought.  The central banks have made it clear that they will be large buyers as needed to backstop the market, and bonds are moving higher in consequence.

As a result, most 10-year sovereign debt yields are now near zero.  The recent rally pushed yields down so quickly that they (sovereign yields) now sit below their lower Bollinger Bands.

6-18 global yield

Still, there are a number of warning signs for the Bond market.  The COT report is the most lopsided it has been in more than a decade.  In addition, Bond speculators are massively over-leveraged Long, and are likely to capitulate the moment the market turns lower.  Plus, sentiment is at absolute extremes, with the most recent reading from sentimentrader.com pegged at 100.


6-18 Bonds Sentiment

The current breakout is following my longer-term expectation, and recently the move higher appears to have gathered momentum.  The price action in Bonds highlights a problem with many technical indicators during a massive bull market – they simply do not work most of the time.  Bonds are significantly overbought technically, but are continuing higher nevertheless.  I fully expect Bonds to see sharp selloffs at times, but I believe we will see another leg higher during the summer as equities move down into an ICL.

6-18 bonds weekly


Investor Cycle Trading Strategy

No trades at present.


Daily Cycle Trader Strategy

No trades at present.  One could consider a quick Short trade, but in a bull market, that is always a risky move


Portfolio Positions Summary

Investor Portfolio –

No trades.

Daily Cycle Trader Portfolio –

None.


Natural Gas Gas

Cycle Counts

Cycle Count Observation

Cycle Position

Cycle Clarity

Daily Day 20 Range 20-26 Days – (2nd  DC) Near Top
 Green
Investor Week 16 Range 22-26 Weeks New Highs – Rallying
Green

 Supporting Indicators

Sentiment Level 48%
Neutral
Commitment of Traders (COT) Blees Rating – 19 (0-100) Bearish to Neutral (Decrease of -9)
Primary Trend (Weekly Chart) Down Bear Market Trend – Possible Trend Change Developing

The Natural Gas market, after four bearish years, is finally breaking out.  And the move is extremely bullish too, as the breakout has come off a clear inverse head and shoulders pattern following a short, bear trapping, Investor Cycle Low.

I cannot speculate as to how it will perform in the year ahead or whether a new bull market is being born.  However, judging by the length and extent of the prior bear market, and the move we see unfolding today, I can comfortably state that I believe the bear market has ended and the lows are behind us now.


6-18 nat gas weekly


The Financial Tap – Premium

The Financial Tap publishes two member reports per week, a weekly premium report and a midweek market update report. The reports cover the movements and trading opportunities of the Gold, S&P, Oil, $USD, US Bond’s, and Natural Gas Cycles. Along with these reports, members enjoy access to two different portfolios and trade alerts. Both portfolios trade on varying time-frames (from days, weeks, to months), there is a portfolio to suit all member preferences.

NOTE:  It’s just $99 for a full 3 months of membership, a fraction of what one stopped out trade is likely to cost you.  Consider joining The Financial Tap and receive two reports per week and the education you need to become a better trader or investor    See >> SIGN UP PAGE!


join-now


Bob.


#


Let the show begin - The Financial Tap

Let the Show Begin


Sample Premium Report published on May 15th, 2016.


Gold Cycle

Cycle Counts


Cycle Count Observation

Cycle Position

Cycle Clarity

Daily Day 16 Range 24-28 Days – 1st or 2nd Daily Cycle Rallying to next DC Top
 Green
Investor Week 3 or 7 Range 22-26 Weeks New Cycle Rally      Green

Supporting Indicators

Sentiment Level 70% (Up 1%)
Significantly Elevated
Commitment of Traders (COT) Blees Rating – 3 (0-100) Extremely Bearish (Slight Improvement)
Primary Trend (Weekly Chart) Down – (Possible Change) Bearish to Neutral

Gold has reached an interesting crossroads, but it’s not alone in doing so.  All of the assets that we track are at similar inflection points in their own Cycles.  The inter-connectivity between Cycles is on full display, and is currently showing a high degree of both positive and negative correlations between assets.

The Gold sector is doing well, and has held up after impressive gains.  It has seen a couple of weeks of price consolidation, but no serious selling.  This points to a strong underlying bid, and is reflective of a bull market.

After bouncing off the 20dma, Gold has been jammed between the 10dma and 20dma.  It has yet to resume the uptrend, as expected, and the coming week should reveal whether the short term bullish case for Gold will play out.  But whether it does or not, Gold is out of excuses.  If it cannot resume its move higher, the bears will likely take control and drive significant selling on the backside of the current Investor Cycle.


5-14 - Gold daily

The precious metals Miners have also held their huge gains. Normally, once the Miners top, the trip to the next DCL is quick and severe.  But not so this time.  The lack of any real retracement in the Miners is indicative of a Gold Cycle ready to move higher.

The sky above the Miners is not completely clear, however; there are warning signs that should not be ignored.  The Gold Miners Bullish Percent Index is a reliable indicator of a Gold Cycle top, and as shown below, appears to have topped and turned lower.  The Miners are leveraged to Gold, so if Gold has topped, the over-stretched Miners will suffer far greater losses than will Gold.  So any current Longs should be in the metal itself this time around.


5-14 miners bullish percent index

Nevertheless, markets often fool traders, and commodity bull markets especially so.  History shows that once a Gold bull market has begun, standard technical indicators can be ignored for the first 6 to 12 months.  Gold can be so relentless and unpredictable in rising off of a long term bottom that technical indicators don’t work well for a period of time.  And if you’re still unsure whether Gold is in a bull market, take a look at the price action in the Miners.  Or look at the level of Gold bullion buying, shown below.


5-14 gold accumulation

Looking at the weekly chart, I still believe that a $200 surprise rally is in the cards.  Few others believe such a move is possible, but I still see the setup clearly, and have good skin in the game to capture such a move.

Despite my being positioned for upside, there are still reasons to be skeptical of Gold’s immediate prospects.  Chief among them is the lack of a clear ICL when one was due.  If Gold were to lose the 20-day moving average or the 10-week moving average, the near term bullish case would be negated and I would brace for a more traditional IC price decline.

The lack of an IC price decline is a primary reason that I see the potential for a $200 rally.  And the presence of a (bullish) pennant consolidation, followed by a new high, provides fuel and a target for a move higher.  All of that said, seeing the upside scenario is exciting, and we can’t be so blinded that we forget that it is only one of several possible outcomes.


5-14 GOLD WEEKLY


Investor Cycle Trading Strategy

I’m Long the Gold ETF rather than the Miners as a precaution.  If Gold breaks down from here, I’ll be out of the position before Gold suffers a 5% decline.  On the other hand, to give the trade the room it would need, a position in the Miners at current levels would need a huge, 20% Stop cushion.


Daily Cycle Trader Strategy

I have 2 Long positions in Gold to capitalize on my view that a strong rally is imminent.


Portfolio Positions Summary

Open Positions – Investor Portfolio –

30% Long position in GLD.  Stops set to $114.50

Open Positions – Daily Cycle Trader Portfolio –

2 Positions long GLD (Gold ETF)- Bought at $123.19 STOP $114.50


Equities (S&P500)

Cycle Counts

Cycle Count Observation

Cycle Position

Cycle Clarity

Daily Day 27 Range 36-42 Days – 2nd Daily Cycle Likely topped – Many days before next DCL.
 Green
Investor Week 17 Range 22-26 Weeks Possibly Topped
     Green

Supporting Indicators

Sentiment Level 62% (Down 1%)
High Optimism
Commitment of Traders (COT) NA
Primary Trend (Weekly Chart) Flat- (Possible Change to Down) Neutral to Bearish

In past weeks, we have discussed every conceivable equity bear market scenario.  I continue to believe that equities have already peaked, and that they are in the process of printing a wide top that will eventually give way to a significant move lower.  From the lens of a bear market, the “give way” point appears to be very near.

On the daily chart, the S&P rallied out of the Half Cycle Low before being rejected, essentially at the 20dma.  As I mentioned at the time, the reaction out of the Half Cycle Low would tell the tale for equities.  If the S&P had been able to push to a new high in the 2nd half of the DC, the bulls would have been cheering and the bearish case diminished.  But that’s not what happened.  As it stands today, the S&P is showing a clear, day 9 DC peak and a large, Left Translated Daily Cycle.

This is exactly what we expected, as mapped below.  The resistance at the 20dma turned the S&P lower, so now it’s a question of downside follow-through.  A DCL is at least 10 days away, and that’s plenty of time for the market to inflict serious damage.


5-14 equities daily

I’m sure that Readers are tired of hearing about the macro case for an equities price decline, especially when it has not correlated well with stock prices for nearly 5 years.  But I think it will be different this time.

Past equity rallies were induced by quantitative easing (QE), and the correlation between QE and equity prices is very clear.  But now, the FED is backed into a corner.  They are so fixated on moving off of a zero interest rate policy (ZIRP) that there simply is no will to pursue a new round of QE.  And without QE, I don’t believe that stocks can sustain prices at 17 times earnings (PE ratio) in a declining revenue environment.   The FED has lost its ability to, beyond rhetoric, intervene in equities, unless the economy rapidly deteriorates or the stock market loses a rapid 20%.  But if that were to happen, the bear market thesis would have played out.


5-14 spx revenue

Like Gold, the S&P is at a critical point in its Daily Cycle.  Although the DC hasn’t completely given way, cracks are clearly evident.

Take a look at retail stocks.


5-14 retail sales up

And the Dow Jones Transportation index has confirmed the negative action.


5-14 dow transports

The IC topping pattern is gaining traction, and the action could get ugly.  I am mindful that equities have not broken down yet, so am careful to remain patient and open to all possibilities.  And remember, the bullish case I outlined 6 weeks ago called for a consolidation similar to what we’ve seen before a move higher can begin.

Even so, the bulls should be concerned since the market appears to have chosen a bearish path.  If the current Investor Cycle is to recover, we should see an almost immediate rise in prices from here.  But that’s not what I expect.  I believe that the recent turn lower will soon give way to serious selling.  The Cycle timing is perfect for a top, and the technical indicators (below) clearly show a Cycle that has topped and is turning over.


5-14 equities weekly


Investor Cycle Trading Strategy

I’m still Short with a sizable position.  Unless price rises to exceed the previous all-time high, I will remain patient.


Daily Cycle Trader Strategy

I’m now Short 2 positions, and might add a 3rd if equities break down next week.


Portfolio Positions Summary

Open Position – Investor Portfolio –

40% Short the S&P 500 via the ETF – SDS.  Bought at $20.33 and $19.76  STOP $17.26

Open Position – Daily Cycle Trader –

Two positions short the S&P 500 via the ETF – SDS.  Bought at $18.85  STOP $17.90


CRUDE OIL

Cycle Counts

Cycle Count Observation

Cycle Position

Cycle Clarity

Daily Day 31 Range 36-42 Days (2nd Daily Cycle) Near DC Top
 Green
Investor Week 14 Range 22-26 Weeks Near Top due to Bear Market Green

 Supporting Indicators

Sentiment Level 40% (Down 1%)
Neutral
Commitment of Traders (COT) Blees Rating – 32 (0-100) Bearish – Improved.
Primary Trend (Weekly Chart) Down Bear Market Trend

Crude Oil has surprised me.   I expected a Left Translated Daily Cycle, similar to the S&P, but that’s not what we’ve seen.  Instead, Crude’s price has continued to move higher.  It’s not a huge surprise, though.  Crude Oil is coming out of a 12 month, 70% decline, so an overshoot on the counter-trend rally is well within what’s reasonable.

The Right Translation of the Daily Cycle (below) might appear bullish, but I don’t believe that it carries the usual longer-term bullish implications.  I expect that when the equity markets begin to give way, Crude will suffer a serious decline along with them.


5-14 crude daily

Since Crude makes extreme moves into and out of Cycle pivot points, an overshoot on the counter-trend rally is not really a surprise.  But regardless of the strength of the rally, I fully expect that the last IC Top will hold, and that the series of lower IC tops common to bear markets will continue.

That being the case, $50.92 should be the ceiling of the current move, although I doubt price will manage to get close to that level.  Crude has had a nice run off the bottom, but it is still a counter-trend move that will turn sharply lower when the selling begins.  I do not know if the February lows will eventually be taken out, but I believe that the bear market will last for several years.  My bias remains to expect downside action from Crude, especially late in a Cycle.


5-14 crude weekly


Investor Portfolio Trading Strategy

No positions.


Daily Cycle Trader Strategy

No positions.


Portfolio Positions Summary

Open Positions – Investor Cycle Portfolio –

None.

Open Positions – Daily Cycle Trader Portfolio –

None.


$US DOLLAR

Cycle Counts

Cycle Count Observation

Cycle Position

Cycle Clarity

Daily Day 9 Range 18-22 Days – (DC #4)  Seeking DC Top
Green
Investor Week 14 Range 18-22 Weeks Topped – Failed Cycle – Seeking ICL AMBER

 Supporting Indicators

Sentiment Level 44%
Slightly Pessimistic
Commitment of Traders (COT) Blees Rating – 97 (0-100) Extremely Bullish (Dropped 3)
Primary Trend (Weekly Chart) Flat Neutral

The Dollar is showing surprising strength for week 13 of an Investor Cycle.  The reversal off the May 2nd low has been strong, but the weekly timing is not supportive of May 2 also being an Investor Cycle Low.  So we’ll need at least 1 more Daily Cycle to complete the current Investor Cycle.  With the current Daily Cycle on Day 8 (the location of the last DC top) there is a good possibility that the current Dollar rally has run its course.


5-14 dollar daily

The Dollar’s downtrend since December remains dominant, and the Weekly cycle count is too early for an ICL.  These two factors lead me to believe that more downside is ahead, with the best case for the Dollar being a double bottom over the next month.  If the worst happens, the Dollar could see a sharp decline to 90 or below.


5-14 dollar weekly


Investor Cycle Trading Strategy

No trades for now.


Daily Cycle Trader Strategy

No Trades


Portfolio Positions Summary

Investor Cycle Portfolio –

None.

Daily Cycle Trader Portfolio –

None.


U.S Bonds

Cycle Counts

Cycle Count Observation

Cycle Position

Cycle Clarity

Daily Day 14 Range 20-26 Days – (DC#?) Approaching Cycle Top
 Green
Investor Week 3 or 10 Range 22-26 Weeks Unknown      AMBER

 Supporting Indicators

Sentiment Level 54%
Elevated
Commitment of Traders (COT)  NA
Primary Trend (Weekly Chart) Uptrend Bullish


Bonds are gaining a bid at present, with capital flooding to the perceived safety of the sector.  As with the action in Gold, the Bond market’s Cycles are aligning well with a bear market in equities.

5-14 bonds daily

Months ago, I drew a potential Cup and Handle pattern for Bonds, and it’s shown below.  The pattern is now complete, and a continuation of the rally that began in 2014 is likely to begin.

From a Cycle perspective, we have an early IC count regardless of which spot we choose for the last ICL.  An early Cycle count means that Cycles can accommodate a rise in Bonds if equities decline and a flight to the safety of Bonds ensues.


5-14 bonds weekly


The Financial Tap – Premium

The Financial Tap publishes two member reports per week, a weekly premium report and a midweek market update report. The reports cover the movements and trading opportunities of the Gold, S&P, Oil, $USD, US Bond’s, and Natural Gas Cycles. Along with these reports, members enjoy access to two different portfolios and trade alerts. Both portfolios trade on varying time-frames (from days, weeks, to months), there is a portfolio to suit all member preferences.

NOTE:  It’s just $99 for a full 3 months of membership, a fraction of what one stopped out trade is likely to cost you.  Consider joining The Financial Tap and receive two reports per week and the education you need to become a better trader or investor    See >> SIGN UP PAGE!


join-now


Bob.


Natural Gas Gas

Cycle Counts

Cycle Count Observation

Cycle Position

Cycle Clarity

Daily Day 21 Range 20-26 Days – (2nd  DC) Late in Cycle – Seeking DCL
 Green
Investor Week 11 Range 22-26 Weeks Potentially topping point.
Green

 Supporting Indicators

Sentiment Level 47%
Slightly Elevated
Commitment of Traders (COT) Blees Rating – 11 (0-100) Extremely Bearish (Worsened)
Primary Trend (Weekly Chart) Down Bear Market Trend – Possible Trend Change Developing

Watch out to anyone long natural gas here.  This is a precarious setup as natural gas appears to be on the edge of a decent cliff.  The Cycle count is positioned well for a fall, as natural gas is late into the second daily Cycle that topped back on Day 6.  As natural gas closed right below the 10dma, that fall may already be in motion.  Once the trend-line completely gives way, I expect a fast drop into the DCL,


5-14 nat gas daily


Investor Cycle Trader Strategy

No trades


Daily Cycle Trader Strategy

No Trades


Portfolio Positions Summary

Investor Portfolio –

None

Daily Cycle Trader Portfolio –

None.


No Lack of Optimism – Free Report

Sample Premium Member Report published on Feb 6th, 2016.


Gold Cycle

Cycle Counts


Cycle Count Observation

Probable Outlook

Cycle Clarity

Trend
Daily Day 25 Range 24-28 Days – 2nd  Daily Cycle Topping Area

Green

Flat
Investor Week 10 Range 22-26 Weeks Bullish    Green
Flat
4Yr Month 41 Range 48-52 Months Bearish

Green

Failed

Finally! After months of tepid action in Gold, a strong Daily Cycle rally is underway. So far, it’s been as strong as any rally of the past four years, and it’s not over. I had wondered why Gold has not benefited from the aggressive equity selloff…but no longer. Bonds are up sharply, and Gold has also begun to rise, fueled by equity outflows in search of a safe haven. Without question, Gold is locked in a powerful Right Translated Daily Cycle, one that has so far added over $100 in 24 trading days.

It’s easy to get carried away whenever we see a move like the current one. Based on comments in the Bull Bear Forum as well as a surge in bullish tweets, traders have become extremely bullish on the precious metals complex. Nothing lifts traders’ spirits like a good rally, and the Gold sector has certainly seen that. From my vantage point, however, the bullish shift in sentiment doesn’t – yet – represent more than the natural flow of emotions during a normal 4 to 6-month Investor Cycle.

Let’s focus first on the Daily Cycle. Although the move higher has been explosive, the DC is at day 24, so expecting further gains goes against the odds. Gold is well past due for a DC Top, and is extremely overbought technically. Based on history and market behavior, it’s difficult to see how the current rally can continue until overly-optimistic sentiment is cleansed through a DCL. In addition, we need to keep the current move in perspective. Since its peak in August 2011, Gold has shown a powerful Daily Cycle in every Investor Cycle. So Gold is not out of the bearish woods quite yet.


2-6 gold daily

Turning to sentiment, history has shown that as sentiment increases, so does the willingness of traders to chase assets higher. A self-fulfilling loop of higher-prices-leading-to-stronger-sentiment-leading-to-higher-prices takes over. Price gets far ahead of itself, and the buying becomes ever more speculative, leveraged, and “weak handed”. Near the top of long term Cycles, inexperienced traders are generally holding significant leverage, hoping for further gains. The first hint of a reversal/top sends them scrambling for the exits, and a selling frenzy begins the process of unwinding overly bullish sentiment. The process isn’t over until bullish sentiment has cleared and a long term Cycle low arrives.

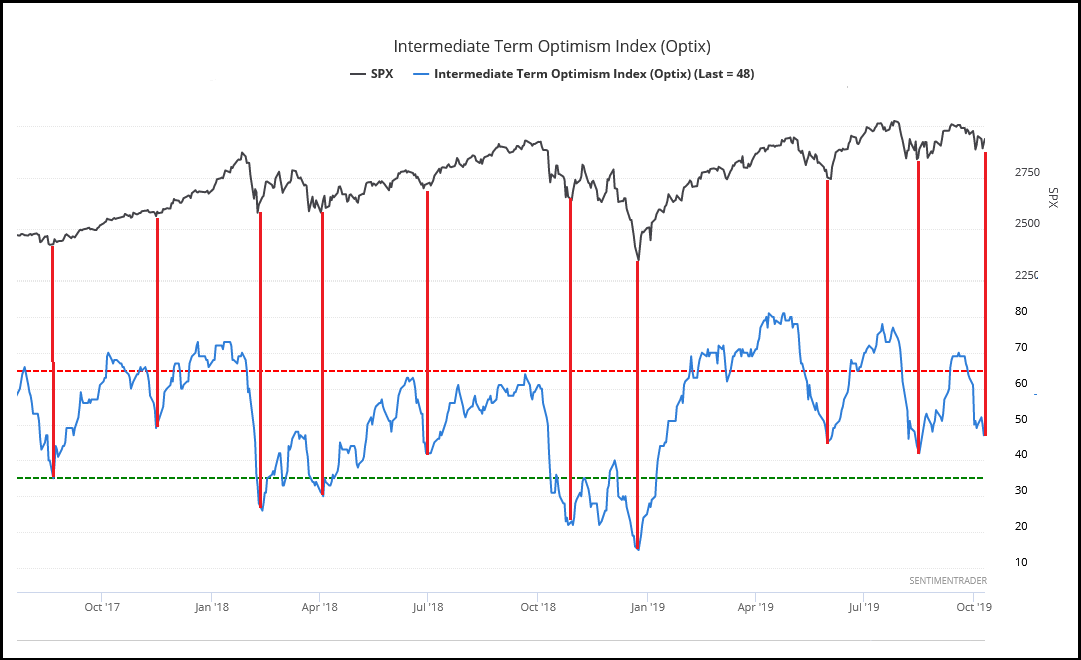
We’re far from that decline at present, but sentiment is rapidly rising. The below sentiment chart doesn’t include most of this week’s rally, but still shows sentiment near the level where every Investor Cycle of the past 4 years has topped. This is hard evidence that we can’t ignore. In past bear market ICs, Gold has topped near current sentiment levels. We can always hope for some sort of a change in character, but trading as if “this time is different” would be placing bias above historical data.


2-6 Gold sentiment

On the weekly chart, our analysis remains fairly straightforward. For the past two months, the current rally has been fairly predictable in terms of magnitude. A 10% rally during the first 10 weeks of an IC is average, and the current $100 move is slightly beneath that level. The Miners, too, show only average Investor Cycle performance so far. And this despite a giddy, sharply rising chart.

The point is that we need to be cautious in looking at the current DC, and in projecting a longer term bullish advance based on its performance. While it’s great to finally have a real rally in Gold, there’s no guarantee that the bear is dead. I’m not saying that it cannot be different this time…in fact, I hope that it is. But until the market and price action tell us Gold has turned the corner, we need to be cautious. The first real test will come at $1,191, the previous Investor Cycle high. If Gold can pierce that level, we can begin to consider whether a change in cyclical trend might be underway.


2-6 gold weekly

At this point, I’d like to throw evidence-based analysis aside, and discuss what I feel about precious metals.

I believe that a change in character could be underway across the precious metals complex. There is plenty of evidence to support the view that equities have entered a bear market and, if so, it stands to reason that Gold, which has been inversely correlated to equities for years, will benefit from a flow of funds from equities.

The bear market in Gold brought a 50% decline in 4 ½ years. The Miners have fared even worse, with averages falling by 80% and individual names by as much as 99%.  By any account, the bear market has been long enough and the declines deep enough to satisfy even the most virulent bears. Since the Miners’ January low, some of the more viable and well-positioned companies are already up over 100%,. Others have tripled off their lows. These signs of a bottom are so pronounced that it’s easy to see how they could be precursors to a new bullish advance.

I’m an optimist by nature, but in trading I’ve learned to be more cynical due to my aversion to unnecessary risk. I trade from Cycle evidence and Gold has yet to show us a higher IC high, and that’s what we need to have real hope of a new bull. It’s easy to forget, but the most recent ICL made a new multi-year low, while the Miners matched their low from 13 years ago. So caution is still warranted. It’s caution that enabled me to weather the bear market without losing capital.

However, since hope springs eternal, I’ll show a last chart with the ratio of the HUI Index (Gold Miners) to Gold. The mining stocks were sold off to levels against Gold never before seen. The sell-off was so severe that the Miners were trading at 50% discounts to prices seen at trough of the 2000 bear market. We know that extremes can continue for long periods, but the reversal in Miners relative to Gold is now very clear. Remember, each past Gold market bottom has begun with the Miners outperforming Gold.


2-6 crashing hui to gold


Investor Cycle Trading Strategy

I sold my Long position when it hit the topping point of a typical Investor Cycle. There are no trades here at present.


Daily Cycle Trader Strategy

No positions for now. I did try a quick topping trade in GDX, but was forced out on the power of Friday’s rally. I bought during an extremely overbought time in the Cycle, so I thought it was a good setup, but the action proved that markets can at times extend well beyond extreme levels. If we see a continuation higher on Monday, I will likely have the confidence to attempt another Short trade.


Portfolio Positions Summary

Open Positions – Investor Portfolio –

None.

Open Positions – Daily Cycle Trader Portfolio –

None.


Equities (S&P500)

Cycle Counts


Cycle Count Observation

Probable Outlook

Cycle Clarity Trend
Daily

Day 13

Range 36-42 Days – 1st or 4th Daily Cycle.

Avoid

Green

Failed
Investor Week 3 or 23 Range 20-24 Weeks AMBER
AMBER Failed
4Yr Month 78 Range 50-56 Months- 8th Investor Cycle.

Bearish

Green Up

It’s been 7 years since the start of the bull market, and signs of a market breakdown are now everywhere. A look at past bull market tops (1998-2000, 2005-2007) shows warning signs and divergences as much as two to three years before the top, all while the general equity indices are making new highs.

These signs are evident in today’s market. The commodity sector represents raw materials, and it has been in a deflationary spiral for a couple of years. Emerging markets, even those not heavily dependent on commodities, have been in a bear market for at least two years as well. In particular, China, the bellwether of the world economy and poster child for the current expansion, has been sounding a bearish alarm for well over a year.

Additional warning signs have appeared. High yield (junk bond) debt has been under enormous pressure recently. As investors begin to rein in speculative risk exposure, the high yield market is one of the first to turn down before of a market top. In addition, cyclical sectors like banking and transportation have already broken down. Moreover, the US treasury yield curve is flattening again, as demand for longer dated treasuries, the ultimate safe-haven asset, is once more rising.

The bottom line is that equities have stopped advancing, and have moved sideways for well over a year. Repeated attempts to breakout on the high side have failed, and the current top has turned into solid resistance. With valuations still at historical extremes and corporate sales growth flat, the ability for the market to sustain its current level is being seriously challenged. In short, I believe that the equity markets have topped and that a bear market is well underway.

That said, it’s crucial to remember that nobody knows in the short-term where the market is headed. That is both the beauty and the difficulty of trading – the markets are far too complex to predict with certainty over short time periods. And that’s especially true in the current environment, where whipsaws and volatility are so extreme that trading either side – Long or Short – is a challenge. Overall, a near term a rally would not surprise me, but I expect it to be short-lived. With Daily and Weekly Cycle failures in place, the market is showing unmistakable bear market characteristics. That being the case, my primary expectation is for a break below the January 20 low. I see this scenario as more likely than a large, counter-trend rally.


2-6 equities daily

From an Investor Cycle standpoint, the bearish action should be clear. I’m now fully in the bear market camp, so I expect most of the significant moves to be to the downside. The last three attempts at a reversal higher have all failed, so the “buy the dip” ethic is clearly over.

Nevertheless, it would be foolhardy to rush in on the Short side and expect immediate downward pressure. That could happen, since we expect generally lower prices, but we need to be mindful that tops take time to form, and bear market declines are riddled with sharp rallies. My primary concern with trading Short is that equities have not had a particularly sharp rally yet. Sentiment is particularly low, so the door is open for a surprise rally. The trend is down, and I expect massive declines in the near future. But in the short-term, I’m open to all possibilities.


2-6 equities weekly


Investor Cycle Trading Strategy

No trades for now. I’m still trying to determine an accurate weekly count. I’m hoping for a good rally, one that would move price back toward 2,000 and provide clarity. We could be looking at a classic Left Translated IC, with a top near week 10 and future Daily Cycle highs testing the declining trend-line.

To see the market break to a new low would confirm the bear market, but it would also mean that the Investor Cycle could be coming to an end. If that happens, Shorts could be subjected to a fairly significant counter-trend move.


Daily Cycle Trader Strategy

I’m out of my Long positions for a small profit. There is no clear choice, Long or Short, at the moment, and the extreme market volatility makes trading equities here not worth the risk. It’s time to wait for the Daily Cycle to resolve itself.


Portfolio Positions Summary

Open Position – Investor Portfolio –

None

Open Position – Daily Cycle Trader –

None.


CRUDE OIL

Cycle Counts


Cycle Count Observation

Probable Outlook

Cycle Clarity

Trend
Daily Day 12
Range 36-42 Days (1st or 4th Daily Cycle)  Avoid Green Down
Investor Week 3 or 23
Range 20-24 Weeks

Depends on IC

AMBER Down
4 Year Month 10 Range 48-52

Bearish

Green

Down

Along with many other commodities, Crude Oil crashed during the past year. The Crude market has become so erratic that it is impossible to determine what Crude will do next. From here, it could rally 20% or fall 20% and neither would surprise me. So I’m left with no choice other than to declare that I simply have no clue where Crude prices will be 1 to 3 weeks from now. Nor does any other analyst, regardless of what he or she might predict.

In recent weeks, Crude appears to have become highly correlated with risk and equity markets. Maybe it’s the other way around, that is, the equity markets are tracking Crude. Regardless, the markets are trading in tandem, and if equities are preparing for another significant leg lower, Crude will likely sell-off in sympathy. Since Crude Oil is still in the early stage of a bear market, extreme moves in price are normal, especially for this asset class.


2-6 crude daily


Investor Portfolio Trading Strategy

No positions at present.


Daily Cycle Trader Strategy

No positions at present.


Portfolio Positions Summary

Open Positions – Investor Cycle Portfolio –

None.

Open Positions – Daily Cycle Trader Portfolio –

None.


$US DOLLAR

Cycle Counts

Cycle Count Observation

Probable Outlook

Cycle Clarity

Trend
Daily Day 40
Range 18-22 Days – 4th Daily Cycle     Bearish
Green Up
Investor Week 24
Range 18-22 Weeks  Bearish

Green

Failed
3Yr Month 18 Range 36-42 – 6th Investor Cycle. Bullish Green Up

The Dollar sold off sharply as markets came to the realization that the FED will not be able to continue to tighten rates. The idea of higher rates is simply a fantasy. The FED raised rates by 0.25% in December, but recent economic news combined with pressure on risk assets (equities and high yield bonds) all but ensures that the FED will not be raising rates again anytime soon. With both the Daily and Investor Cycles well past their topping points, the realization of no more rate increases was a catalyst for a Dollar decline.

The Dollar fell further at the end of the week, but stabilized by the close on Friday. Friday could well become the Daily Cycle Low. It’s difficult to predict day-to-day Dollar moves after one of the largest declines in years, but I will note that the Daily Cycle Low is due at the same time the sell-off looks to be complete. A failed Daily Cycle is in play, however, so it’s prudent to expect that any rally will quickly roll over.


2-6 dollar daily

The Dollar action suggests that the ICL decline I expected is underway. The decline will help to clear out sentiment and prepare the Dollar for what should be another big leg higher.

A double top is, potentially, in play, and many investors are very quick to point it out. Unfortunately, I believe that the investors are falling prey to bias in favor of positions they hold in a correlated asset class. In particular, a double top is not supported by the Cycle evidence. At this point, an uptrend is still underway, with only higher highs and higher lows.

More importantly, a currency trades in relation to other foreign currencies. That is, the Dollar can be priced only in relation to another currency, be it the Euro, Yuan, Yen, etc. When we consider that China is blowing through its FX reserves, that the emerging markets are extremely fragile, and that both the ECB and JCB (Japan Central bank) are deep in quantitative easing, it is hard to see how the Dollar could suffer anything beyond a significant Investor Cycle Low.


2-6 dollar weekly

Investor Cycle Trading Strategy

No trades.


Daily Cycle Trader Strategy

No trades.


Portfolio Positions Summary

Investor Cycle Portfolio –

None.

Daily Cycle Trader Portfolio –

None.


U.S Bonds

Cycle Counts

Cycle Count Observation

Probable Outlook

Cycle Clarity

Trend
Daily Day 25 Range 20-26 Days – (DC#3)  Bearish    Green Up
Investor Week 13 Range 22-26 Weeks

 Neutral

Green

Failed
3Yr Month 23 Range 50-56 Months-

Bullish

Green

Up

I’d like to provide additional clarity to earlier comments about an equity market top and general economic weakness. The below chart shows the difference in yield between 10-year and 2-year treasury bonds. As the economy expands, investors seek riskier assets and sell the long bond, driving its yield up, so the spread generally increases.

However, as the economic Cycle ages and sentiment begins to sour, the long-term outlook becomes poorer and risk increases. When this happens, the 10-year bond is bought, either for safety or because investors don’t feel the risk/reward tradeoff of risk assets justifies putting capital to work in them. This drives the yield down on the long bond, and decreases the spread between it and the 2 year.

This fluctuation in yield is apparent in the business Cycle as the economy expands and then contracts. Because the business cycle is already beyond the normal timing for a recession, and with the long bond’s curve flattening quickly (as it has right before past recessions began), only another massive QE program can stop it.   Notice below how past QE programs stooped the yield curve from flattening.


2-6 10yr versus 2 year

This is why I am overall bullish on the US bond market – it is seen as an ultimate safe haven asset. It is not the national debt level or the long-term ability to sustain it that drives price – one look at the Japanese market should made that clear. In times of trouble, US treasury bonds are considered the safest of all asset classes, and almost all large capital flows into them.

A significant weekly trend change has occurred. Because we have an Investor Cycle Low and an Investment Cycle High that exceed those of the last IC, bonds have confirmed an upward trend. And the move higher might not be over yet. With a Week 12 high, the Cycle should both be Right Translated and stay above the prior Cycle Low. This trend change is important in that it confirms the weakness in the equity markets. After a brief decline into the next ICL, bond strength could push yields to record lows.


2-6 bonds weekly


Investor Cycle Trading Strategy

No trades at present. I will not attempt to catch a top and trade against the trend. Our best bet will be to wait several weeks and buy the next ICL aggressively.

Daily Cycle Trader Strategy

No trades at present. I’m staying out – the market is too strong to Short.


Portfolio Positions Summary

Investor Portfolio –

None.

Daily Cycle Trader Portfolio –

None.


Natural Gas Gas

Cycle Counts

Cycle Count Observation

Probable Outlook

Cycle Clarity

Trend
Daily Day 14 (Failed) Range 20-26 Days – (2nd DC) Bearish Green AMBER
Investor  Week 8 Range 22-26 Weeks Depends on Daily

Green

Down
3Yr Month 43 Range 48-52 (Months) Bearish Green Down

Natural gas is an asset locked in a massive bear market, showing a recent failed Daily Cycle and a new set of lower highs and lows.  Such an asset is one that cannot be trusted on the Long side anymore, regardless of how bullish the chart or Cycles may have appeared just a few weeks ago.  Opinions are loosely held and when the market dictates it, we change our view to match what price is showing us.

Yes it was an extremely impressive move out of those December lows, but the action since topping in early January shows little confidence or a willingness to follow through. Therefore, I can only assume that the bear market is taking hold again and therefore I must remain bearish on natural gas.


2-6 natural gas daily


Investor Cycle Trader Strategy

N o trades at this time.  Long trades should be off the table, a possible short trade not for another 3-4 weeks.


Daily Cycle Trader Strategy

No trades.


Portfolio Positions Summary

Investor Portfolio –

None

Daily Cycle Trader Portfolio –

None.

Bullish, But Do Don’t Fall In Love – Free Report

Sample Premium Member Report published on Nov 14th, 2015.


Gold Cycle

Cycle Counts


Cycle Count Observation

Probable Outlook

Cycle Clarity

Trend
Daily Day 30 Range 24-28 Days – 3rd Daily Cycle Bearish

Green

Failed
Investor Week 17 Range 22-26 Weeks Bearish    Green Failed
4Yr Month 40 Range 48-52 Months Bearish

Green

Failed

Gold moved relentlessly lower again this week, ignoring normal Daily Cycle timing. The move has given life to my frequent warnings about the persistent, unyielding declines that bear markets often bring. Bear markets are notorious for elevating investors’ hopes through sharp moves higher that quickly give way to crushing declines. And as we’ve witnessed with Gold, the declines can be prolonged to the point that they wear down even the most ardent bulls.

Surprisingly, there is still an endless stream of pundits and investors declaring that Gold’s bear is over. Too many traders seem more preoccupied with catching a possible turn higher than with acknowledging the reality of the past 4 years and understanding Gold’s potential downside. Bullish bias helps to explain why, despite Gold’s sitting at a new 5-year low, sentiment is still not at bearish extremes. In addition, from the latest commitment of traders report (COT), it’s clear that speculators are still offloading bullish Long positions as they begin to accumulate bearish Short positions.

When combined with an Investor Cycle weekly count that easily supports another Daily Cycle, the above two indicators – Sentiment and COT – make me very cautious regarding Gold.

The daily chart shows just how ugly the current action has been, and it speaks volumes about the underlying bearish tone of the precious metals complex. On the surface, the current decline is severe enough to look like the final move into an ICL. But Gold’s longer term Investor Cycle suggests that another DC is needed to complete the IC.

In the immediate term, Gold is clearly oversold and should move higher in a new Daily Cycle rally. But based upon the sector’s clear weakness, it would not be a surprise if the rally lasted only a day. Remember, the next DC should be the last of the current Investor Cycle, and if it’s true to form, should end with twenty sessions of panicked selling.


11-14 gold daily

Platinum is already sharply lower, and produced a failed Investor Cycle a few weeks ago. Silver also shown a failed Investor Cycle in Week 5. And now, at week 16, it has fallen back beneath the lows of the last two Investor Cycles and sits just $0.30 away from the week 5 intra-day low. Silver looks extremely vulnerable at present, but is still far from the oversold levels that is can attain at IC Lows. Silver could easily see 4-5 weeks lower as Gold finds its ICL in December.


11-14 Silver Weekly

Although Gold’s week was negative overall, the bleeding was fairly contained. And after four consecutive weeks lower, it’s due for a Daily Cycle rally that should push it temporarily higher. The rally could be fast and convincing enough to cause steadfast bulls to again proclaim that a double bottom has occurred.

But because the timing and evidence support another significant move lower, I believe that any rally will be very short lived. The new Daily Cycle rally should be just enough to clear oversold technical levels and allow the Bollinger Bands to expand to accommodate the next big decline.

For those asking whether the current decline could be a short, 16 week ICL, I just don’t see it. A perfect double bottom forming with the July low would wrap a nice bow around the bear market, but the evidence doesn’t support it. It is not impossible by any stretch, but it is very unlikely.


11-14 gold weekly


Investor Cycle Trading Strategy

This week, we have virtually the same story as last week: it’s too late in Gold’s Daily Cycle to add a Short position. An opportunity to Short the IC could still come, but the current move has pushed price so far into oversold territory that we would be foolish to chase it. Before I consider a Short trade, I’ll need to see a $40 +/- rally.


Daily Cycle Trader Strategy

Nimble traders could buy a Swing Low (when one arrives), since the Daily Cycle is well past due for a rally. For anyone who takes such a trade, setting tight stops and actively managing/increasing them will be important.

I will personally consider a trade on either a Swing Low or a lower opening and intraday reversal. If I do take a position, it will be with the goal of making a quick profit and getting out by the end of the week.

In addition, I’m still waiting for a strong 2-3 day rally to put on a Short position. This should be a high percentage trade because of the high likelihood of a big decline into December.


Portfolio Positions Summary

Open Positions – Investor Portfolio –

None.

Open Positions – Daily Cycle Trader Portfolio –

None.


Equities (S&P500)

Cycle Counts


Cycle Count Observation

Probable Outlook

Cycle Clarity Trend
Daily Day 35 Range 36-42 Days – 2nd Daily Cycle.

 Bearish

Green

Up
Investor Week 12 Range 20-24 Weeks Bullish
Green Failed
4Yr Month 77 Range 50-56 Months- 8th Investor Cycle.

Bearish

Green Up

I’m not going to dive too deeply into analysis of the equity markets this week since they have been tracking well to our short term expectations. In the longer term, though, there is less clarity. There is significant evidence to support both the bear and the bull cases.

The equity markets are once again at a cross-roads, with bulls seeing a one year consolidation that will give way to the next bull leg higher, and bears believing that the current counter-trend rally is now exhausted and that the real bear market is on deck. Both scenarios have creditable evidence, so arguing either side can easily become an exercise in pumping bias.

It’s no secret that I favor the bullish outlook, and I’ve have positioned my capital as such. But the bears have good evidence too, so I won’t waste your time working to convince you that the bullish case is the best option. That said, I do want to make sure I’ve clearly laid out my thinking. My primary evidence is simply the dominant bullish trend, which has now been interrupted by a rare market correction. But since the correction didn’t break the bull market trend, history tells us that this should be a buying opportunity. We do, however, need to be wary of a potential trap.

At this point, given the long term uncertainty in equities, it’s most important to be flexible in our viewpoint. As a general rule, we should never be afraid to drop (or to switch) a view on an asset. While it’s OK to be wrong on an outlook, it is not OK to stay wrong out of stubbornness.

Until Wednesday, the decline on the daily chart was orderly and controlled. But on Thursday, once the 20 day moving average was lost, a small bout of panic selling ensued, with equities seeing two consecutive 1% declines. And even though the decline was deeper than expected, from a timing standpoint, the it has perfectly matched the outlook I’ve presented for two weeks. Since the S&P never showed a clear Half Cycle Low, I believe that we will see only one decline, and that into the next DCL. It’s unclear whether the current move down will become the DCL, but with price having retraced 38.2% of the Daily Cycle rally, there is a strong chance that equities will open higher next week.


11-14 equities daily

I said I wouldn’t spend time promoting the bullish case this week, but I found one piece of evidence with an excellent track record that I wanted to share. The ICI (mutual fund industry) released its latest equity mutual fund flow figures, and for the latest week, domestic flows took a big hit. Investors pulled more than $12 billion out of US mutual funds, the largest net withdrawal since August, 2011.

The chart below shows that total net flows are hovering below $100 billion, a level seen only in late 2008/early 2009 and late 2011. If we look further, these large equity outflows have corresponded with market corrections of greater than 10%. So the current level of outflow is associated with the bottom of a move, and not the start of a large decline.


11-14 Equities mutual fund flowsSource: Sentimentrader.com

Newton’s 3rd Law tells us that for every action, there is an equal but opposite reaction…and that relationship is certainly found in financial markets. After rallying for over 6 weeks and 200 points, equities can’t be expected to continue higher forever. On the charts, the current decline looks scary, but it’s only a 38.2% consolidation of the move since the last DCL. To look at a one week decline in isolation without acknowledging the preceding six weeks is cherry-picking, which can lead to a warped view of events. Netting it out, because the current decline has come during the timing band for a DCL, it is a very normal development.

We could conceivably see another week lower, since Daily Cycle timing would support the move. But I believe the market is almost finished back-filling, and that a new rally is likely to begin this week.

The rally out of the coming DCL will finally provide some clarity on the bull market’s intentions. If the market has already topped and the current action is just part of a long and wide topping pattern, we will see the coming Daily Cycle rally top out quickly and give way to a rapid decent.

But if the dominant bull market trend resumes, as I think it will, the traditionally strong holiday period should lift the market significantly higher. If the bull is to remain alive, it will need the FED’s help, first by first keeping rates unchanged and then by extending support for zero interest rates.

Flexibility will be the watchword for equities. We don’t need to always be right, but we must avoid being wrong for a significant amount of time.


11-14 equities weekly


Investor Cycle Trading Strategy

I took a first small Long position and hope to add to it. I’d been waiting patiently for the right setup, and when it arrived Friday, I took it. Once we see a turn higher and a clear DCL, I will consider both adding to the position and increasing stops to the DCL point. If this trade is successful, we should hold it for around 6 weeks.


Daily Cycle Trader Strategy

I took a trade before the Swing because the markets became significantly oversold in the short term. I’m looking to hold this position for 15-18 trading days.


Portfolio Positions Summary

Open Position – Investor Portfolio –

25% Position in SSO (2x Long S&P ETF).  Bought at $62.32  Stop at $55.05

Open Position – Daily Cycle Trader –

Two positions in SSO (2x Long S&P ETF) Bought at $61.92  Stop at $57.35


CRUDE OIL

Cycle Counts


Cycle Count Observation

Probable Outlook

Cycle Clarity

Trend
Daily Day 14
Range 36-42 Days (2nd Daily Cycle)  Neutral Green Up
Investor Week 12
Range 20-24 Weeks

Neutral

Green Down
4 Year Month 9 Range 48-52

Bearish

Green

Down

This week, Crude oil clearly and unequivocally declared its longer term intentions. It topped on just day five of the current Daily Cycle and had an early DC failure on day 12, so the path forward is decisively lower. The bad news for Crude is that there should be at least twenty more trading days before the next DCL, and that’s plenty of time to suffer some serious selling.

But considering that Crude has seen eight straight declining sessions, additional immediate downside is probably too much. So I expect Crude to rally back toward the 10 day moving average before rolling over. But since the short term trend has clearly turned and now aligns with the long term trend, it’s extremely unlikely that Crude can recover from here. And since both trends are in agreement this late in the Cycle, it’s very difficult to see how Crude can avoid further significant declines.


11-14 crude daily

Crude has been in a cyclical decline for only 16 months, while a bear market can last for three to four years. So while it’s impossible to know how long the current bear market will last, to expect it to end with the coming ICL is far too optimistic and ignores reality. So long as Crude oil supplies are bursting at the seam, it will be impossible to have any recovery in price.


11-14 Crude Inventories

I originally expected that the bear market declining trend-line would be breached during the current DC, but the resumption of the bear market caused it to again serve as significant resistance. Going forward, the trend line should now contain Crude’s price.

Since this is only Week 11 of the Investor Cycle, Crude could be looking at significant declines during the next couple of months. Unless the Dollar weakens and tops well before expected, I suspect that Crude may make deeper, multi-year lows in the near future. Whenever a bear market is rooted in poor fundamentals, as is the case with Crude, we should expect an overshoot to the downside.


11-14 crude weekly


Investor Portfolio Trading Strategy

I expect a short rally next week, and if Crude complies, I will use is as an opportunity to take a Short position. The Investor Cycle timing is just too young to ignore the downside potential here.


Daily Cycle Trader Strategy

We were stopped out of the Long trade, so there’s nothing to do but move on. Now I’m looking to reverse the trade and go Short given the clear Cycle evidence. But after eight straight sessions lower, Crude is too oversold for us to get in Short now. We need to be patient and let price come to us.


Portfolio Positions Summary

Open Positions – Investor Cycle Portfolio –

None.

Open Positions – Daily Cycle Trader Portfolio –

None.


$US DOLLAR

Cycle Counts

Cycle Count Observation

Probable Outlook

Cycle Clarity

Trend
Daily Day 22
Range 18-22 Days – 3rd Daily Cycle     Bearish
Green Up
Investor Week 12
Range 18-22 Weeks  Caution

Green

Failed
3Yr Month 17 Range 36-42 – 6th Investor Cycle. Bullish Green Up

There is little of note to add to the Dollar’s outlook this week – I can only reiterate that it continues to behave bullishly. I do expect short term weakness, however. With a Swing High in place, and only three days into what looks to be a Daily Cycle decline, the Dollar should fall further next week and break below the 10dma and the rising trend-line.

These moves appear to be part of a standard decline into Daily Cycle Low. A consolidation after 19 days of rising prices is normal behavior, and in this case is very likely a precursor to at least one more rally during the current IC. There is a real bid under the Dollar that is driven by the expectation of a rate hike during the December FED Open Market Committee meeting. I believe, however, that the FED will not hike rates, causing the Dollar to form an IC Top and roll over.


11-14 Dollar Daily


Investor Cycle Trading Strategy

I see no trades at present.


Daily Cycle Trader Strategy

There are no Trades to be taken at present


Portfolio Positions Summary

Investor Cycle Portfolio –

None.

Daily Cycle Trader Portfolio –

None.


U.S Bonds

Cycle Counts

Cycle Count Observation

Probable Outlook

Cycle Clarity

Trend
Daily Day 5 Range 20-26 Days – (DC#4)  Bullish    Green Up
Investor Week 21 Range 22-26 Weeks

 Bearish

Green

Failed
3Yr Month 22 Range 50-56 Months-

Bullish

Green

Up

The response (higher) has been somewhat muted this past week, when we expected a decent counter-trend rally. We’ve been following the inverse relationship of the bond market to equities for some time, so I believe it’s rather telling that bonds could not manage a substantial move higher as equities were aggressively sold off.

But at least we finally see a delayed and extended Bond Cycle turn higher and show us a new Daily Cycle. The weak and steady incline these past few days looks to be establishing a bear flag, which will fall sharply once the equity markets turn higher.


11-14 Bonds Daily


Investor Cycle Trading Strategy

No trades, but a potential short is coming at the top of this Daily Cycle.  In effect, this is a very similar trade with going long Equities.


Daily Cycle Trader Strategy

Could short bonds at the top of this Daily Cycle.


Portfolio Positions Summary

Investor Portfolio –

None.

Daily Cycle Trader Portfolio –

None.


Natural Gas Gas

Cycle Counts

Cycle Count Observation

Probable Outlook

Cycle Clarity

Trend
Daily Day 11 Range 20-26 Days – (1st or 5th DC) Bullish Green Down
Investor Week 2 or 31 Range 22-26 Weeks Bearish

Green

Down
3Yr Month 42 Range 48-52 (Months) Bearish Green Down

It is pretty clear that natural gas has already formed a new Daily Cycle, and is already up to Day 11. The weak action to date made it difficult to make that call, but with Friday’s move, it is difficult to ignore. The problem is that we just don’t know if this is a new Investor Cycle, as you would expect.  We’re finding that although oversold for many months, natural gas is acting horribly and the overall sector fundamentals remain extremely weak.


11-14 natty gas daily


Investor Cycle Trader Strategy

Back to the drawing board and waiting for a clear and sustainable trend to develop.


Daily Cycle Trader Strategy

No trades.


Portfolio Positions Summary

Investor Portfolio –

None.

Daily Cycle Trader Portfolio –

None.

Volatility to Remain – Free Report


Sample Premium Member Report published on Sep 6th, 2015.


Gold Cycle

Cycle Counts


Cycle Count Observation

Probable Outlook

Cycle Clarity

Trend
Daily Day 34 Range 24-28 Days – 1st Daily Cycle Neutral

Green

Failed
Investor Week 7 Range 22-26 Weeks Bullish    Green Failed
4Yr Month 40 Range 48-52 Months Bearish

Green

Failed

At this point in Gold’s Investor Cycle, there are two primary factors in play and I’m closely tracking both. In the immediate term, I’m watching Gold’s Daily Cycle for signs of a turn higher and the beginning of a 2nd DC. In addition, Gold’s long term trend lower should guide our expectations for the next few months. After the coming DCL, the performance of the 2nd Daily Cycle will drive how Gold’s current Investor Cycle unfolds.

When the 2nd DC begins to move higher, I will remain cautious out of respect for a possible continuation of the bear market. If the bear is ongoing, it is likely we will see a top to the second DC before week 10 of the IC.

On the other hand, if Gold’s trend has changed and the yellow metal is embarking on a major bull run, it may be difficult to capture the early part of such a move. Most investors will be weighed down by 4 years of IC declines and the ongoing downtrend.

But before we can observe Gold’s 2nd DC, we need for the 1st DC to end, and that could mean at least one more decline into a DCL. I mentioned my concern about this in Wednesday’s mid-week report. So seeing another drop in Gold would not be unexpected and, if it happens, should not be considered a bearish development. Overall, the current chart setup remains constructive, and Gold is now sporting a slightly lower low from which it can form a 1st DCL. I expect Gold to turn up from here without more downside, although another day or two lower is still possible. In any event, by the end of the coming week, I expect Gold to begin a rally that should at least test the $1,170 top of the last Daily Cycle.


9-5 Gold Daily

There is still a decent amount of fear in the Gold trading community. Watching Silver languish while the Miners retest the last ICL has not in any way inspired the Gold bulls. And seeing the sector’s more speculative assets wobble has made me wary as well. Remember, with the bear market still in force, traders and investors must remain aware of downside risks. Until the trend reverses, early Cycle rallies should only be considered counter-trend moves which can reverse sharply at any time.

Although the current move out of the ICL is still technically just such a counter-trend move, I believe that it has plenty of upside remaining. The IC count tells us it’s still too early for a top, while sentiment has failed to get above even pessimistic levels. So there is plenty of time and fuel for Gold to continue higher. Typically, an Investor Cycle Top occurs only after sentiment has reached a flat-to-elevated level, which is still well above current readings.

Perhaps of greatest importance for Gold is the COT report. All new Investor Cycles begin with some degree of Short-covering, as speculators who were over-Short during the IC decline are caught by the turn higher and forced into panic covering. For Gold, this Short-covering has begun, but the process is nowhere near the level that indicates a new equilibrium has been reached. From the below COT chart, it’s clear that the NET position (black line) is not close to the peaks associated with prior IC tops. This suggests that Gold speculators are still too Short, and that they will likely be forced to cover once the 2nd Daily Cycle gets going.


9-5 Gold COT

To many investors, I know it seems that the Gold sector is trading poorly. But when Gold is viewed in isolation, it’s clear that this is really not the case. In fact, the current move fits our expectations from 6 weeks ago at the start of the current Investor Cycle. Every Cycle forms in a series of ebbs and flows, and we must recognize where the asset stands in the process.

Gold should be close to completing its first DC, and the 2nd DC should see it rally for 2-4 weeks toward the bear market trend line. How Gold performs during its 2nd Daily Cycle, and especially how it moves near the last DC high and the bear market trendline, will shape its current Investor Cycle. Unfortunately for bulls, given the dominant bear market trend and Gold’s tepid movement in the new IC, I expect the declining trend-line to cap the upside move.


9-5 Gold weekly


Investor Cycle Trading Strategy

I’m waiting to add a position here, and will consider more of the current Gold ETF. Trading a Gold ETF will not add much to our bottom line, but because we’re at the advent of a 2nd DC that we expect to roll over early in a continuation of the bear market, it doesn’t make sense for this portfolio to be exposed too Long.


Daily Cycle Trader Strategy

I’m still Long two GDX positions, and these have come close to a 100% retracement of the move up from the recent low.  Price managed to hold up well on Friday, so my expectation remains that Gold will begin its 2nd DC, and that GDX will have a splendid outing when it does.


Portfolio Positions Summary

Open Positions – Investor Portfolio –

Long UGL 10% position.

Open Positions – Daily Cycle Trader Portfolio –

2 Positions Long GDX


Equities (S&P500)

Cycle Counts


Cycle Count Observation

Probable Outlook

Cycle Clarity Trend
Daily Day 10 Range 36-42 Days – 2nd DC

Bearish

Green

Failed
Investor Week 9 Range 20-24 Weeks Bearish
Green Failed
4Yr Month 75 Range 50-56 Months- 8th Investor Cycle.

Bearish

Green

Up

The recent collapse of the S&P toward 1,880 was severe, and pushed every technical indicator well beyond the levels of a typical Investor Cycle Low. Based on the massive bull market trend behind equities, we should expect a huge V pattern reversal that drives a quick move to a new all-time high.

Although it’s still somewhat early for a final verdict, such a huge reversal has failed to materialize. Instead, we continue to see spiking volatility, huge intra-day swings, and an Investor Cycle that suggests that there are more declines ahead. The significant volatility makes all of our outlooks somewhat murky, so any short-term expectations must be held lightly at this point. Keep this in mind as you read the scenario I outline below. It’s only one possibility. But with that caveat, I believe that equities are currently far too short-term oversold. At this juncture, a rally that tests the break-down point would not be at all unusual.


9-5 Equities Daily

We’re faced with an Investor Cycle and bull market dilemma. If the primary (up) trend is intact, equities have seen more than enough of a decline and should be ready to rocket higher. But the severity of the decline and the way it has differed from declines in previous Investor Cycles has me thinking that a more complex market correction is unfolding.

For example, volatility has surged, and significant intra-day market swings have become much more prevalent. With one quarter of all August trading days involving a move of more than 2%, the current correction is nothing like the declines into the 6 previous ICLs.


9-5 2percent S&P moves

In addition, sentiment has collapsed too far too fast, leaving the ratio of bulls to bears at a four year low. The drop in sentiment tells me that the market is running scared, and that a bear market mentality has taken hold. From a contrarian standpoint, the collapse in sentiment is bullish, but with the market in a correction, I’m fearful that it’s just too early for a longer term reversal higher.


9-5 Equities bulls percent

The change in market character can be seen in the VIX index. Panicked, extreme moves in the VIX are almost always a precursor to a large degree, multi-month decline. A massive move in the fear index is typically the result of a large, underlying shift in the market, and these shifts take significant time to fully unfold. In short, what equities are currently showing is not standard Investor Cycle Low volatility, so we should not expect a swift market rebound and a plunge in the VIX.


9-5 Equities VIX

The point is, while the technical picture points to an Investor Cycle Low, the severity and character of the current decline resembles a larger and more complex correction. And the Investor Cycle count is in agreement; even before the decline began, the most likely count showed the current IC at only week 6. A correction similar to those in 2010 and 2011 takes time to unfold, and the current Cycle count supports a decline until mid-to-late October. Seasonality supports this picture as well. Although the early portion of September is often bullish for equities, the middle of September until the middle of October has, historically, been the worst performing period of the year.


9-5 S&P Seasonaility

Looking at the weekly chart (below), we see an initial sell-off that was both sudden and deep. In fact, the weekly candles still indicate trades outside of the lower Bollinger Band. The “hammer candle” from 2 weeks ago was a sign that the markets might have been forming a massive “V” reversal, but the bulls just couldn’t make it happen. If equities were in a typical ICL, we would have expected the bulls to take the market higher.

In summary, so far the declines have been of the ICL variety. But the fact that the market has entered into a correction with such high volatility and so early in the Investor Cycle points to a deeper market correction. But it won’t be a straight line lower, and with markets extended to the downside, we should have a period of stability (maybe 2 weeks higher) that should lead to a short-term top. Only then, after the bulls have begun to feel comfortable that the “buy the dip” narrative will hold true again, will the market be in a position to continue its decline.


9-5 Equities Weekly


Investor Cycle Trading Strategy

I’m looking for a solid Short trade for the Investor Cycle Trading Strategy, but only if the S&P can move back to well over 2,000. Anything near 2,030 would be an excellent place to put on a Short trade.


Daily Cycle Trader Strategy

There’s too much volatility for the time being, although the right trade might actually be to go Long for the next 5 to 7 sessions. But with a failed Cycle in play, I’m not going to take a Long trade. As with the Investor Cycle Trading Strategy, I’m hoping for a rally back over 2,000 so I can place a good Short Daily Cycle trade.


Portfolio Positions Summary

Open Position – Investor Portfolio –

No position.

Open Position – Daily Cycle Trader –

No position.


CRUDE OIL

Cycle Counts


Cycle Count Observation

Probable Outlook

Cycle Clarity

Trend
Daily Day 10
Range 36-42 Days ( Daily Cycle)  Bearish Green Down
Investor Week 25
Range 20-24 Weeks

Bearish

Amber Down
4 Year Month 7 Range 48-52

Bearish

Green

Down

This week, Crude put in one of the best single week rallies on record. Such a move was obviously not the result of bargain hunters or demand buying; it was driven purely by overly-leveraged speculators covering Short positions as the market turned higher. Once such moves get going, they often take longer than six sessions to resolve, so I expect that Crude will continue higher in the coming week as traders continue to cover their Shorts.

The 2nd rally in the current Daily Cycle is beginning to take shape now, and I expect Crude to hit a new Daily Cycle high near the end of the week. If the equity markets are going to recover somewhat during the next 2 weeks, then Crude is likely to follow along. But I’m still very bearish on the entire energy sector and especially Crude oil. From my perspective, the current rally is nothing more than a Short-covering exercise.


9-5 Crude Daily

My primary concern for the energy sector is that far too much Crude supply remains on world markets. And with lower prices causing fiscal problems for the oil-producing nations, I don’t expect a meaningful reduction in world oil supply for a long time to come.

In fact, with this week’s news that President Obama has the necessary votes to ensure the survival of the Iran nuclear deal, we’re going to see another flood of Crude hit world markets at the start of 2016. Even though the sector has entered a bear market, its participants are either unwilling or unable to see the longer term implications of their actions.

As with every bull-to-bear market transition, the players that are heavily dependent the sector are too biased to appreciate (or admit) that there are bad times ahead. After years of absolutely massive capital inflows into the energy sector and despite currently depressed prices, the industry is on track to raise a record $74 billion in 2015. And with world Crude demand relatively flat, the additional $74 billion is only going to ensure that supply continues to constrain price.


9-5 Crude Investement

Moving to the monthly chart, Crude is in month eight of a failed Yearly Cycle. The chart below clearly shows that Crude oil is locked in a cyclical bear market that could take years to resolve. But whatever the longer term outlook, timing dictates a minimum of 4 to 6 more months of lower prices before a Yearly Cycle Low arrives.

If that’s the case, the $62 high from May is almost certainly Crude’s ceiling and should not be exceeded during the current Yearly Cycle. As the current YC continues, it should become the first Left Translated Yearly Cycle in over 6 years (the last one came close), leaving the primary question now as to whether we’re seeing a short 1-2 year correction or the start of a larger, secular bear market.


9-5 Crude Monthly


Investor Portfolio Trading Strategy

No Trades.


Daily Cycle Trader Strategy

We had a great quick Long trade, but the obvious trade is now over. I considered taking another Long trade, but felt that Crude is, at this point, too overbought. If Crude can move well above the top Bollinger Band and further along in the Daily Cycle, I will strongly consider a Short trade.


Portfolio Positions Summary

Open Positions – Investor Cycle Portfolio –

None.

Open Positions – Daily Cycle Trader Portfolio –

None.


$US DOLLAR

Cycle Counts

Cycle Count Observation

Probable Outlook

Cycle Clarity

Trend
Daily Day 10
Range 18-22 Days – 4th Daily Cycle     Bearish
Green Down
Investor Week 17
Range 18-22 Weeks  Bearish

Green

Failed
3Yr Month 15 Range 36-42 – 6th Investor Cycle. Bullish Green Up

The Dollar is at a critical point. The Investor Cycle indicates that it should have at least one more declining, Left Translated Daily Cycle ahead. A very dovish ECB and a stronger US Employment Report helped to push the Dollar to a day 8 top in the current Daily Cycle. If this is the last DC of the current IC – the outlook I favor – then a top at day 8 fits the picture.

But there are bullish undertones to the Dollar’s recent performance – holding the 10dma and a MACD cross – so we should be open to the possibility that the Dollar has already completed a short, 16 week Investor Cycle. But that is not my primary expectation; normal Cycle timing still greatly favors another Dollar breakdown in the near future.  But if the Dollar doesn’t turn lower next week, we could be looking at a surprise, new Investor Cycle.


9-5 Dollar Daily


Investor Cycle Trading Strategy

No Trades currently.


Daily Cycle Trader Strategy

No Trades currently.


Investor Cycle Portfolio –

None.

Daily Cycle Trader Portfolio –

None.


U.S Bonds

Cycle Counts


Cycle Count Observation

Probable Outlook

Cycle Clarity

Trend
Daily Day 50 Range 20-26 Days – (DC#1)

Bearish 

   Green Failed
Investor Week 11 Range 22-26 Weeks

 Bullish

Green

Failed
3Yr Month 20 Range 50-56 Months-

Bullish

Green

Up

We saw a fairly big move in the bond market to close out the week. The strength in bonds was primarily a result of the US employment report and the resulting weak performance in equities. Since the strength occurred during the timing band for a DCL, I suspect we are most likely seeing day 2 of a new DC.

My primary concerns are that the bond Cycles are no longer obvious since the counts are very long. Plus, if the S&P is to perform well for several weeks in September, I don’t see bonds moving higher in a new Daily Cycle at the same time. Bonds and equities don’t necessarily need to be inversely correlated, but a convincing equity market move laced with “buy the dip” hope is not an environment for strong bond performance.


9-5 Bonds Daily

The equity – bond market inverse correlation may make it difficult to see where the bond market is headed in the short term, but not so for the longer term. If equities are going to correct into a deep October Cycle Low, the below weekly bond chart reflects that expectation.

The bond market is putting in a very impressive Investor Cycle, and has foreshadowed the current equity market correction. With bonds retesting their upside channel breakout, an equity market collapse into October will surely mean a continuation higher for the bond market. As risk and volatility in equities increases, the capital leaving equities should make its way into the relative safety of the US bond market, pushing bond prices significantly higher. Overall, the current bond IC continues to perform well, and there is plenty of room in both price and Cycle timing for bonds to continue to rally.


9-5 Bonds Weekly


Investor Cycle Trading Strategy

No trades at present, but I will look to buy a Long position once we see a DCL.


Daily Cycle Trader Strategy

I’ll look for a Long trade at the next DCL.


Investor Portfolio –

None.

Daily Cycle Trader Portfolio –

None.


Natural Gas Gas

Cycle Counts


Cycle Count Observation

Probable Outlook

Cycle Clarity

Trend
Daily Day 25 Range 20-26 Days – (4th DC) Bearish Green Flat
Investor Week 21 Range 22-26 Weeks Bearish

Green

Down
3Yr Month 40 Range 48-52 (Months) Bearish Green Down

Natural gas prices have been locked in a downtrend pretty much the entire 21 weeks of this Investor Cycle.  From what I can tell there continues to be too much supply of natural gas in this market place.  And if that were not enough to keep prices down, investment into new production continues despite this over-supply.  That’s not going to stop prices from swinging between a Cycle trough and Cycle high, Cycle after Cycle.  But we should have little to no expectation of a new bull market run anytime soon.

For where Natural gas is currently trading, it appears to be within its final Daily Cycle of this current Week 21 Investor Cycle. There is a chance that one more Daily Cycle is to come, considering my forward expectations for Equities and Crude. But for now, we have a Failed Daily Cycle on Day 25 that is seeking a Cycle Low. One more flush would do the trick, I would imagine.


9-5 Nat gas


Investor Cycle Trader Strategy

No trades, not enough clarity.


Daily Cycle Trader Strategy

No Trades.

Investor Portfolio –

None.

Daily Cycle Trader Portfolio –

None.


Freereport

Sample Premium Member Report published on July 26, 2015.


Gold Cycle

Cycle Counts

Cycle Count Observation

Probable Outlook

Cycle Clarity

Trend
Daily Day 36 Range 24-28 Days – 3rd Daily Cycle Bearish

Green

Failed
Investor Week 19 Range 22-26 Weeks Bearish Green Failed
4Yr Month 38 Range 48-52 Months Bearish

Green

Failed

The premise of last week’s report was that Gold was seeking a bottom. The evidence strongly suggested that Gold was on the verge of printing a major Cycle Low from which a counter-trend rally could begin. Whether the counter-trend rally would be temporary or something more was uncertain, but all of the signs of an impending bottom were there. As I write this week’s report, Gold’s late week action gives me confidence that we may well have found the bottom and begun the expected bounce.

Before I dive into specifics, I’d like to stress that we lack real confirmation of a reversal. The bottom call is based solely on the capitulation nature of Gold’s recent decline, coupled with its reversal during Friday’s session. I am speculating that a turn higher began because Gold’s technical readings are at extreme levels and cannot be sustained.

In last week’s review of the Daily Cycle, I had hoped that Gold would continue to drop into Thursday’s session before rallying into the weekend. And that’s what happened. At this point, the reversal is unconfirmed, but Gold’s drop did hit a significant low at $1,072, a deeper low than last Sunday night’s plunge. Gold’s requirement to form a Swing Low is close ($1,100.80), and a move above that level will confirm it.

The Miners were especially encouraging, as they reversed sharply higher into Friday’s close. The idea that they may have bottomed on Friday is supported by secondary evidence: Timing, COT and sentiment all show an asset that’s ripe for a DCL and ICL.


7-24 gold daily

When reviewing the COT report last week, I detailed how traders were positioned at extreme levels against Gold. This week, the picture has become even more extreme, with readings at record levels. This is very strong evidence that an ICL is imminent.

What is especially interesting is that commercial traders now have the smallest level of Gold hedges ever. And speculators are short Gold by the 2nd most on record. This massive short position shows that speculators are stacked entirely on one side of the trade. Since all new Investor Cycles begin as short-covering rallies, once Gold turns even slightly higher, the unwind of these leveraged, speculative positions will fuel the next IC rally.

The COT reports are among the most reliable and consistent of the technical indicators I follow, and I believe the current numbers are screaming “ICL”. Since they line up perfectly with an 18 week Cycle, it’s difficult to see much more downside without a counter-trend rally to correct the imbalance.


7-24 Gold COT

The Miners are interesting too, although we need to remember that they can become so stretched in their moves that caution is needed to avoid developing premature conclusions. That said, the Miners are telling us that an ICL is occurring at present.

GDX is a proxy for the mining sector as a whole, and last week it fell sharply to hit a record price low, one that is lower than any price since its inception. With Gold many hundreds of dollars above its 2008 crash level, GDX plunged more than 10% below its 2008 crash low. It also saw its highest volume ever this week, with half a billion shares trading hands (3x to 4x normal) in what can only be describe as massive capitulation. And GDX also saw its 9th big declining week out of the past 10.

Looking at the weekly chart (below), this past week’s candle was a full 10% below the lower Bollinger Band, and with the RSI(5) falling below 5. These are record levels that are simply unsustainable, and they are occurring in the timing band for a DCL and an ICL. Lumped together with the other evidence presented here, these are perfect contrarian indicators. And because we witnessed a solid reversal into the close on Friday, I suspect it might be the very early sign of a new IC rally.


7-24 GDX weekly

We were searching for a bottom last week, but this week’s action has turned the question to whether Friday marked a bottom. The right answer for those trading Gold should be, of course, that we don’t know yet. We do know that the evidence in support of a bottom is so great that we expect any turn higher to be the start of a new IC move. At this point, if Friday does not turn out to be the ICL, I expect that the next price low will absolutely mark the ICL.

Given an impending ICL, is it fair to expect it to be the end of the bear market? Unfortunately, it’s impossible to know, and I’m not prepared to make a prediction at this point. I do think that the bear market low is finally on the horizon, that the length of Gold’s decline and extent of its losses suggest that we’re almost certainly beyond the bear’s seventh inning stretch. But, as always, we must expect a continuation of the trend until Gold proves otherwise.

The first order of business is to extract some gains from the expected ICL. A new IC rally could be very sharp, but a top might occur in as few as 3 weeks. It’s important to understand that any trades need to be early to avoid being whipsawed by an extremely Left Translated Cycle. And that’s a real possibility – there is fear that the sector will turn lower again, so the conviction to hold a Long trade through sharp declines is not very strong.


7-24 Gold Weekly


Investor Cycle Trading Strategy

Since Cycles tell us that Gold is likely to form another Left Translated Cycle, this is a difficult Long trade setup. Going Long here is against the trend, so requires careful and light-footed positioning. It’s not ideally suited for the slower, buy-and-hold nature of this portfolio. Depending on how the IC rally unfolds, I will not push to capture a big position, but will instead target gaining exposure to the market that will allow me to be conservative and take profits fairly early.


Daily Cycle Trader Strategy

I entered 2 Long GDX positions on Friday, both because the Miners were extremely oversold and due a bounce, and because the entire sector was turning in real-time. I don’t know if this trade will capture the “ICL turn”, but there is decent evidence to support it. And if Friday was the turn, it would not be surprising to see these position return 20% in very short order. I will look to exit these positions by Day 12 of the Daily Cycle.


Portfolio Positions Summary

Open Positions – Investor Portfolio –

None.

Open Positions – Daily Cycle Trader Portfolio –

2 Positions Long GDX.


Equities (S&P500)

Cycle Counts

Cycle Count Observation

Probable Outlook

Cycle Clarity Trend
Daily Day 14 Range 36-42 Days – 1st or 6th Daily Cycle (depends on IC)

Bullish

Green

Up
Investor Week 3 or 41 Range 20-24 Weeks
AMBER Up
4Yr Month 73 Range 50-56 Months- 8th Investor Cycle.

Bearish

Green

Up

We need to avoid reading too much into the current action, so the equity market outlook will be short and sweet this week. The overarching theme at present is that price is moving in a narrow, tight trading range. Equities have seen a period containing the 3rd most crosses above and below its 50 day moving average in the market’s history, an indication of the struggle to find a new shorter term trend.

By now, my stance regarding equities should be clear: the markets remain in a dominant Investor Cycle up-trend, so the path of the least resistance should be to the upside, into open territory with little overhead resistance. Recent Investor Cycle timing suggested that equities were due for a decline similar to that in October, but instead, the market held up relatively well, and the bullish portion of the Cycle is now underway.

We’re on Day 12 of a new Investor Cycle and this week’s sharp drop should end up becoming a significant “buy the dip” opportunity. I expect an almost immediate reversal from this point, and for the market to finally begin climbing into new, all-time high territory.

The 4 day decline was scary, and many saw it as an ominous sign of an impending plunge. But I believed (and wrote last week) that we would see a steep shakeout before the market turned higher. Well, this is certainly that. We will have confirmation of direction once the market declares its intentions around 2,044, the last DCL. A move below that level would cast a bearish pall on the market.


7-24 Equities Daily

This week’s sharp decline left behind a rather ugly bearish engulfing candle. But that’s just one secondary indicator in an ocean of technical data points. Cycle timing rules my analysis, so it’s important to consider that my preferred framework has equities in only week 3 of a new IC. For that reason, and because we’ve seen such massive Right Translated Cycles for consecutive years, I expect equities to rise to a new all-time high over the next few weeks. Even if the current IC forms as a Left Translated Cycle (my primary expectation), we should see considerably higher prices from the S&P before the threat of a failed Cycle comes into play. Considering the market consolidated for the past 2 months without a significant price drop, I’d place very high odds on the market setting new record highs, even if they are only temporary.


7-24 Equities Weekly


Investor Cycle Trading Strategy

Our trades were executed exactly to plan, and that’s the best we can hope to do. I was clear in my belief that it made sense to wait for a pullback before entering Long positions, and once the pullback arrived, I entered on the weakness.

You might not want Long equity exposure based on the chart, and I understand the sentiment. But I still like the Cycle setup. With the stop just 38 points below the current level, we are risking only 1.7% of the portfolio in exchange for having significant exposure to a potential blow-off move. Regardless of the final result, the risk/reward profile of the trade is skewed in our favor.


Daily Cycle Trader Strategy

We’re still Long and with the same stop as the Investor Cycle trading strategy. At this point the trade requires patience. But I suspect we’re going to know within 2 weeks whether the Equity trades will be profitable.


Portfolio Positions Summary

Open Position – Investor Portfolio –

40% Portfolio Position Long S&P via ETF – SSO

Open Position – Daily Cycle Trader –

2 Positions Long via SSO


CRUDE OIL

Cycle Counts

Cycle Count Observation

Probable Outlook

Cycle Clarity

Trend
Daily Day 40
Range 36-42 Days (2nd Daily Cycle) Bearish Green Down
Investor Week 19
Range 20-24 Weeks

Bearish

Green Down
4 Year Month 5 Range 48-52

Caution

Green

Down

Crude is beginning to exhibit more normal Cycle behavior, and that should serve us well in the future. The sell-off has been brutal, and Crude has proven how capable it is of extreme moves. In the short term, at day 40 in the current DC, a DCL is due. And judging by the carnage in the Crude pits, I would be surprised if the current decline lasted much longer.

That said, Crude should see another Left Translated, failed Daily Cycle lower after the impending DCL arrives. A bounce to start a new DC should, at best, fill the gap Crude left when it fell sharply to confirm the current, failed Daily Cycle. The prior DCL at $56.51 is probably the absolute best case scenario for a bounce in the coming weeks, but that, too, might be too optimistic at this point. Crude suddenly (and again) looks very weak, just as it has entered into the most dangerous portion of the Investor Cycle.


7-24 Crude Daily

Sentiment has turned south and is back into pessimistic territory. Remember, though, that Sentiment is not a good timing tool. And if this is the bear market I believe it is, sentiment is capable of dropping to very low levels for a considerable period of time.


7-24 Crude Sentiment

Another leading indicator for Crude is the performance of energy sector stocks. The energy producers of the S&P are telling us that Crude is again in serious trouble. As seen below, these stocks often lead declines in Crude by a few weeks, so it’s an ominous sign that Crude sentiment is down just as the energy producing stocks are being sold off aggressively.


7-24 crude bullish percent

This Investor Cycle continues to follow the script outlined many months ago, as per the trend-lines below. And I continue to believe there is one more Daily Cycle ahead for Crude in the current IC. That means Crude should bounce next week and rally for $3-$5 before turning lower to test the prior ICL near $43.

Crude might find support at that level, since the ICL will, at that point, be well into the 20+ week range. But if this is a serious bear market, Cycle length may not matter – Crude can push the extremes of a Cycle without regard to history. If the current IC doesn’t breach the previous ICL, Crude could be setting the table for a big, Left Translated crash in prices during the upcoming Investor Cycle. As you can gather, I’m not at all positive on Crude and believe that significantly lower prices are ahead.


7-24 Crude Weekly


Investor Portfolio Trading Strategy

No trades at present, but I’ll be looking to place a Short trade at the top of the next Daily Cycle.


Daily Cycle Trader Strategy

No trades at present, but I’ll look to go Short at the next DC top.


Portfolio Positions Summary

Open Positions – Daily Cycle Trader Portfolio –

None.

Open Positions – Investor Cycle Portfolio –

None.


$US DOLLAR

Cycle Counts

Cycle Count Observation

Probable Outlook

Cycle Clarity

Trend
Daily Day 25
Range 18-22 Days – 2nd Daily Cycle Neutral
Green Up
Investor Week 11
Range 18-22 Weeks Bullish

Green

Up
3Yr Month 13 Range 36-42 – 6th Investor Cycle. Bullish Green Up

Coming into week 11 of the Investor Cycle, which based on a standard Cycle is essentially now the start of 2nd Half. Therefore, based solely on timing, the risks to the downside will begin to mount. And because this IC looks to be at best a side-ways consolidation, meaning that it is likely too late to see a higher high form, those risks are to be watched closely.

But I doubt this IC advance is over just yet, even though a dip into the next Daily Cycle Low should be forthcoming. We still have a 3rd Daily Cycle to follow this one and the dollar could do quite well for at least the beginning portion of that Cycle. A move towards 100, to test the prior prior IC highs set in March, is possible. From that point, the Cycle would settle down to complete what is a full 20-24 week, sideways consolidation.


7-24 Dollar Weekly

Investor Cycle Trading Strategy

Still Long the Dollar/Yen position, but the dollar has advanced too far in its Cycle and this position looks tired. When a position fails to respond further to the expectation, there is a greatly increased chance that the trade is going to reverse on you. I will be closing this position on Monday.


Daily Cycle Trader Strategy

No positions currently. Cycle is at the mid-point of a side-ways trending Cycle, need to remain patient.


Investor Cycle Portfolio –

Short Yen position taken via the ETF, YCS.

Daily Cycle Trader Portfolio –


U.S Bonds

Cycle Counts

Cycle Count Observation

Probable Outlook

Cycle Clarity

Trend
Daily Day 20 (Failed) Range 20-26 Days – (DC#3)

Bearish

Green Failed
Investor Week 21 (Failed) Range 22-26 Weeks

Bearish

Green

Failed
3Yr Month 18 Range 50-56 Months-

Bullish

Green

Up

The Bond market is surprising us here with a Day 17 high that will likely become Right Translated when finally complete. Buying has been brisk, as the RSI pushes above 70 we’re seeing some interesting underlying strength begin to develop now. This is absolutely nothing like the behavior of what I expected would be a final Daily Cycle. And judging by the strength of this Cycle, I would imagine this is more like a 1st Daily Cycle, lending plenty of weight to the idea that the Investor Cycle has actually bottomed.


7-24 Bonds Daily

There are no guarantees this is a new Investor Cycle, because we can at times experience these strange or deceiving Daily Cycles where there is some unexpected strength for a brief period, before the dominant trend and Investor Cycle downturn continues. But those are more anomalies, rather than typical, and this action looks and feels to me as if we’re already in week 4 of the Investor Cycle. I’m not going to mark it as a new Investor Cycle just yet, although based on the price pattern here I give it some 70% that the bond markets are heading higher over the remainder of the summer.


7-24 Bonds Weekly


Investor Cycle Trading Strategy

No Trades, but a good decline in the week(s) to come will form a DCL and would be a good opportunity to take a long position.


Daily Cycle Trader Strategy

I’m going to wait for a DCL to consider taking a long position.

Daily Cycle Trader Portfolio –

None.

Investor Portfolio –

None.


Natural Gas Gas

Cycle Counts

Cycle Count Observation

Probable Outlook

Cycle Clarity

Trend
Daily Day 12 Range 20-26 Days – (3rd DC) Bearish Green Flat
Investor Week 15 Range 22-26 Weeks Bearish

Green

Down
3Yr Month 38 Range 48-52 (Months) Bearish Green Down

The Natural Gas Investor Cycle is still pointing lower (bear market) and as it enters week 15 of the Cycle, its pull on the Daily Cycle will begin to increase. You all know I’m rather bearish on Natural Gas here and I believe this current 3rd Daily Cycle has already topped on Day 10 (double top). In that case, it will be heading lower towards a DCL that will form by around August 10th. From there, the declines could begin to accelerate in a 4th and final Cycle, possibly deep enough for fresh multi-year lows.


7-24 Nat Gas Daily


Investor Cycle Trader Strategy

No trades planned.


Daily Cycle Trader Strategy

No trades planned.

Investor Portfolio –

None.

Daily Cycle Trader Portfolio –

None