
Follow the Process – Public
Trading Summary
Gold – Short gold and miners
S&P – None
Crude Oil – None
$USD – None
Bitcoin – Long Bitcoin
Video Report
In this video, I cover the standard Cycles of Gold, Equities, Crude, Dollar and Bitcoin, from a Daily and Weekly perspective. See below the video for any charts or images I presented that might be of interest. Also the Cycle counts, sentiment, COT blees rating are listed below the video.
Gold Coverage – Minutes 0:00 – 18:25
Equities – Minutes 18:25- 29:40
Crude Oil – Minutes 29:40 – 35.22
US Dollar – Minutes 35.22 – 38:58
Bitcoin – 38:58 – End
Cycle Counts
Gold Cycle
| Cycle | Count | Observation |
Cycle Trend |
Cycle Clarity |
| Daily | Day 10 | Range 24-28 Days | Topped | GREEN |
| Investor | Week 20 | Range 22-26 Weeks | Topped |
GREEN |
Supporting Indicators
| Sentiment Level | 60% |
Bearish |
| Commitment of Traders (COT) |
Blees Rating – 9(Range 0 = Bearish 100 = Bullish) |
Bearish COT picture
|
| Primary Trend (Weekly Chart) | UP | Bullish – New Bull Trend |
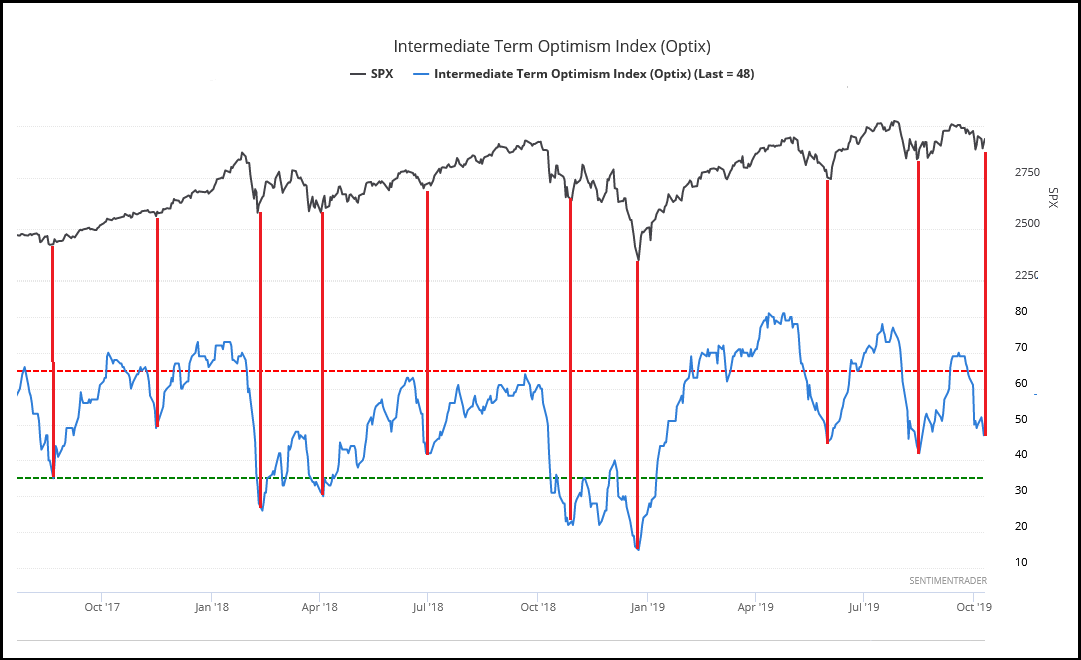
S&P500
| Cycle | Count | Observation |
Cycle Position |
Cycle Clarity |
| Daily | Day 7 | Range 38-44 Days | New Cycle |
Green |
| Investor | Week 19 | Range 26 Weeks | Mid to Late Cycle |
Green |
Supporting Indicators
| Sentiment Level | 48% |
Bullish |
| Primary Trend (Weekly Chart) | Up | Bull Trend |
CRUDE OIL
| Cycle | Count | Observation |
Cycle Position |
Cycle Clarity |
| Daily | Day 7 | Range 36-42 Days | Early Cycle | Green |
| Investor | Week 19 | Range 22-26 Weeks | Mid to Late Cycle | Green |
Supporting Indicators
| Sentiment Level | 35% |
Bullish |
| Commitment of Traders (COT) | Blees Rating (0-100) – 80 | Bullish |
| Primary Trend (Weekly Chart) | Down | Post Crash. |
$US DOLLAR
| Cycle | Count | Observation |
Cycle Position |
Cycle Clarity |
| Daily | Day 7 | Range 15-20 Days | Topped – Failed. |
GREEN |
| Investor | Week 16 | Range 16-20 Weeks | Late Cycle |
GREEN |
Supporting Indicators
| Sentiment Level | 56% | Neutral |
| Primary Trend (Weekly Chart) | UP | Up-trend |