Cycle Chart Setup – Bonds
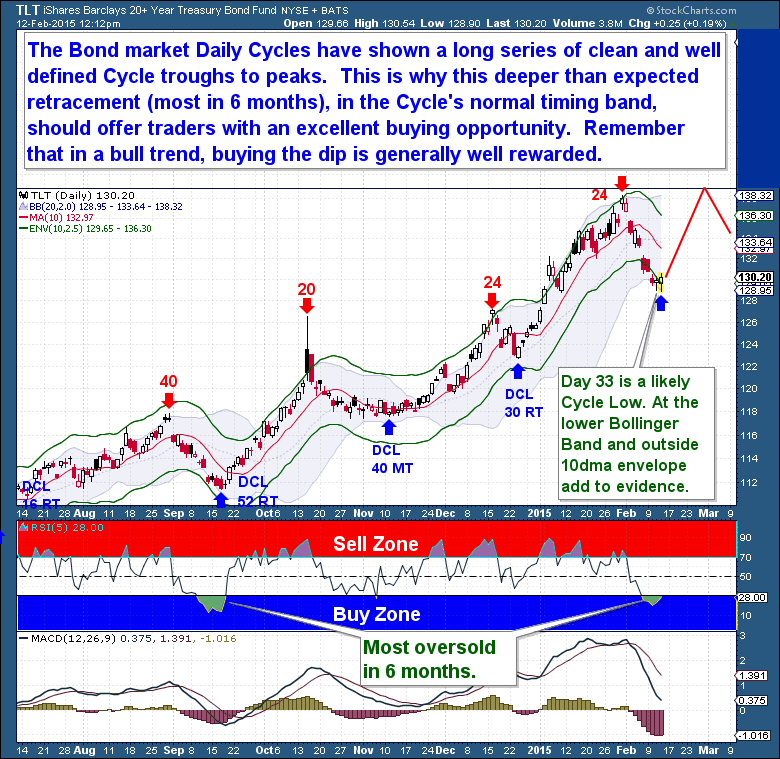
Up until last Friday, the decline shown in the bond market was anticipated because the next logical Cycle Low was due. The ebb & flow nature of the bond Cycles are very visible, clear, and well defined on the chart below. And in a bull market trend, this type of pattern makes it relatively easy for us to predict both the top and low of each Cycle.
But the bond market sell-off has intensified this week, to the point where the expected Daily Cycle Low should have been comfortably behind us by now. The extent of this sell-off is approaching levels normally reserved and experienced during the deeper Investor Cycle Low, and each of those past Investor Cycle Low’s have led to some pretty substantial gains.
I doubt that’s what is occurring here, I still favor a standard Daily Cycle Low here that is likely to produce at least a powerful counter-trend rally. I say counter trend because the worst case scenario is that this coming Daily Cycle rally forms a double top before turning lower towards a true Investor Cycle Low. Regardless, a rally is forthcoming and we know in any bull market uptrend, the dips should be bought.
The Financial Tap publishes two member reports per week, a weekly premium report and a midweek market update report. The reports cover the movements and trading opportunities of the Gold, S&P, Oil, $USD, US Bond’s, and Natural Gas Cycles. Along with these reports, members enjoy access to two different portfolios and trade alerts. Both portfolios trade on varying time-frames (from days, weeks, to months), there is a portfolio to suit all member preferences.
You’re just 1 minute away from profitable trades! please visit: https://thefinancialtap.com
