A Cycle Has Clocked – Public Version May 21st
CYCLES ANALYSIS
$US Dollar – Cycle Counts
|
Cycle |
Count |
Observation |
Outlook |
|
Daily |
Day 14 |
Range 18-22 Days – 3rd Daily Cycle |
Bearish |
|
Investor |
Week 12 |
Range 18-22 Weeks |
Neutral |
|
3Yr |
Month 12 |
Range 36-42 – 3rd Investor Cycle. |
Bullish |
|
Secular |
Bear |
Dollar most likely in tail end of a secular bear market |
Neutral |
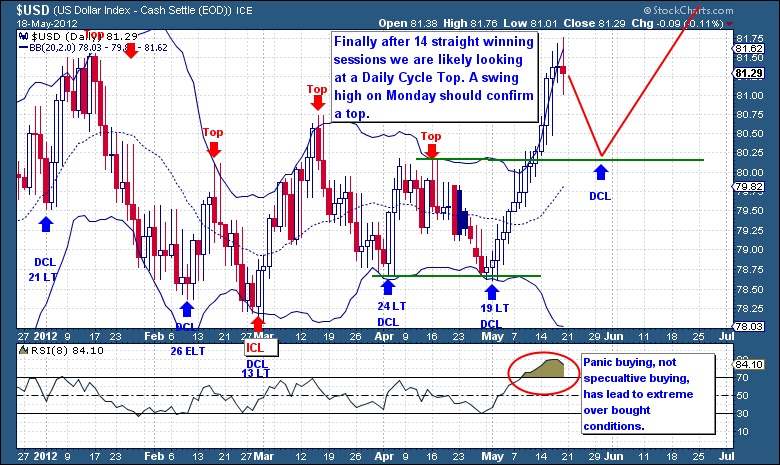
The 14 straight winning session streak finally came to an end this past Friday and in its wake left behind the threat of a daily cycle top (See glossary at end of report for description of Cycle terms). The speed and strength of this rally has left the oscillators in extremely overbought readings. Along with an advanced Daily Cycle count, this setup should induce a natural and violent count trend rally.
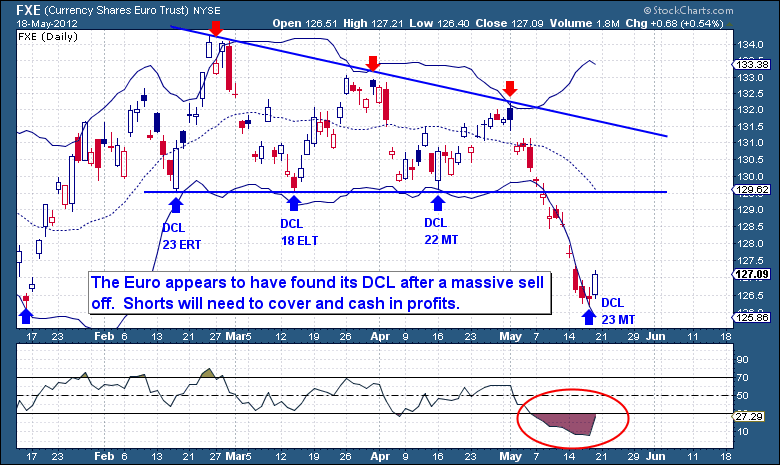
As we’ve reported recently, much of the U.S Dollar strength can be traced to the weakness shown by the Euro currency. Greece is on the brink of collapse, and deeper than expected slowdowns across the European periphery are threatening to bring down the entire European Monetary Union. As a result, massive capital flight out of Europe is now well underway. This movement is well represented within the EuroDollar Cycles, where the Euro recently broke down and collapsed (failed) below the previous Daily Cycle Low.
Just as the Dollar is showing extreme overbought conditions, the Euro is flashing opposing extremely oversold oscillators. With a swing low in the Euro, a likely impressive short covering rally should take hold.
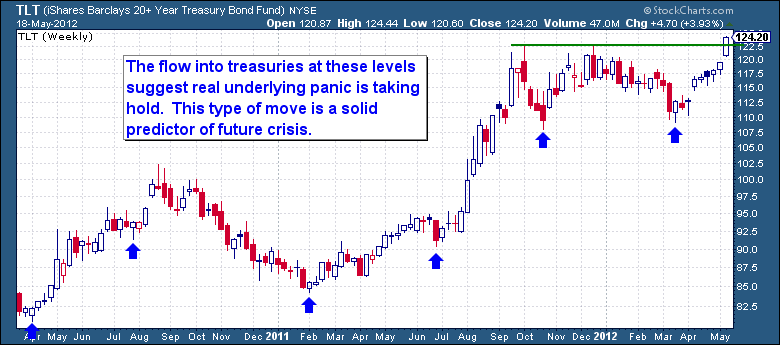
If there was any doubt that this Dollar rally was defensive and not speculative in nature, then one only needs to look as far as the treasury markets for the evidence. With an impressive weekly burst above prior double Investor Cycle tops, investors are willing to buy treasuries at all-time high prices. Such a large world-wide and conscious decision to buy U.S debt at record low yields simply illustrates the sheer panic of this recent move. Such levels of fear and desperation rarely ever simply dissipate, much more often than not they are an early warning to what lies directly ahead.
$US Dollar – Trading Strategy
We should be seeing a move down into the 3rd Daily Cycle Low begin this week. 4th Daily Cycles are typically weak and left translated cycles that correspond to the ending portion of the more dominant Investor Cycle. For this reason any long Dollar purchases will be extremely limited.
GOLD – Cycle Counts
|
Cycle |
Count |
Observation |
Outlook |
|
Daily |
Day 3 |
Range 22-28 Days |
Bullish |
|
Investor |
Week 1 |
Range 18-22 Weeks – 1st Daily Cycle |
Bullish |
|
8Yr |
Month 43 |
Range 90-100 Months |
Bullish |
|
Secular |
Bull |
Gold in the latter parts of a powerful secular bull market |
Bullish |
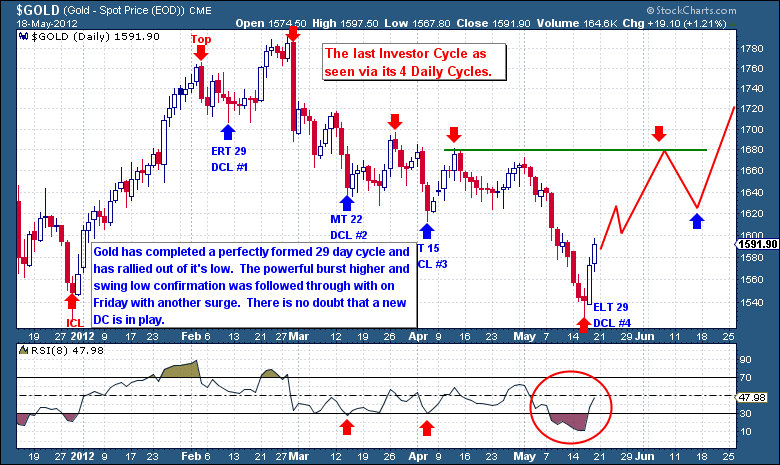
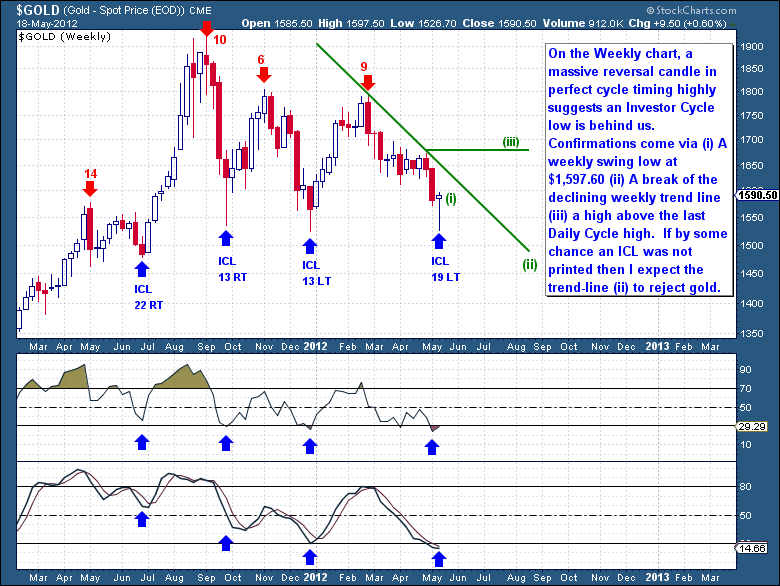
Our long and often impatient multi month and multi cycle wait for a major low appears to be finally over. As I’ve expected for some time now, it appears that a major cycle low above the $1,523 (Dec 29th) prior low has printed. From a Daily Cycle perspective, there is no doubt; a DCL was printed on May 16th. The cycle was just too deep (29 days) and too oversold for it to drop much further. The $70 burst over two short days (in light of risk markets dropping) is just too powerful and noticeable to ignore, such bullish action must belong to a new Daily Cycle.
Such powerful moves out of cycle lows almost always represent what I call realization points. These events occur when traders have exhausted a particular strategy to one extreme, resulting in a massive shift (covering) to the other side of the trade. As the shift begins to take hold, the realization quickly sets in that the cycle “has clocked over” and the up trending phase (new cycle) has begun.
What we don’t know with certainty yet is whether this low also represents an Investor Cycle Low. The Investor Cycle is the more dominant cycle and it runs for some 18-22 weeks. As they typically only occur 2 to 3 times per year and are normally born out of extreme conditions, they do leave behind “genetic markers” that can help us identify future lows. The majority of ICL’s leave behind the following cycle markers:
- A low in the timing band (18-22 weeks).
- A Failed Daily Cycle.
- A severe and noticeable ending sell-off.
- Oversold technical oscillators.
- Extremely low sentiment.
- A bullish COT profile.
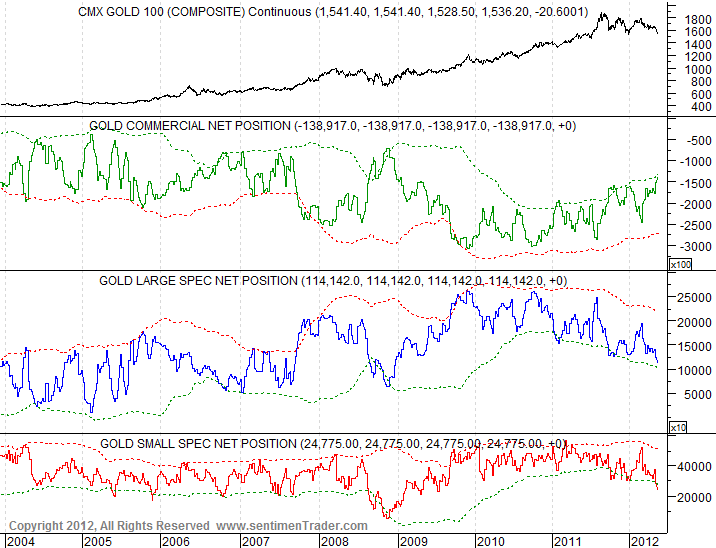
With regards to timing, gold found a weekly low on Week 20, right in the expected timing band. It ended in not only one, but 3 consecutive failed daily cycles, the only Investor Cycle of this entire gold bull market to show such deeply sold and left translated daily cycles. In terms of a sell off, this Investor Cycle produced a 0% return (nearly failed) while ending in a classic waterfall decline. It dropped from a high of $1,800 to $1,525, a 15.2% decline from the top of the cycle. Almost all technical indicators (RSI, MACD etc) show deeply oversold levels and sentiment towards gold matches (see chart below) levels seen only at significant past ICL’s. The COT report (see chart below) is showing a bullish setup only seen at deeply oversold ICL’s. Overall, I believe all conditions for an ICL have been more than adequately met.
Sentiment aligning with past Investor Cycle Lows.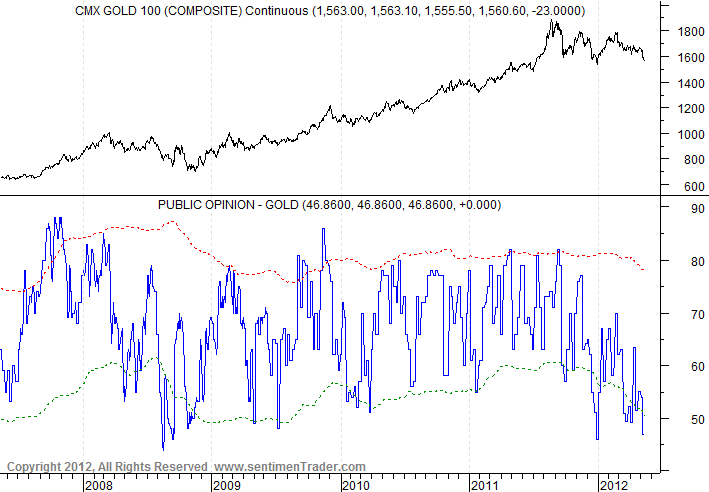
Very favorable Gold COT report as spec’s are reduced and commercial’s not seeing the value in being short at these levels.
When viewing the weekly gold cycles, they appear well formed and easily distinguishable. The final 3 week waterfall decline, and the ensuing massive reversal ($70) hammer candle is very typical of an Investor Cycle Low. The reversal came on the back of very large and positive volume, despite the fact that risk assets were falling and the dollar was rising. Such persistent selling pressure, deep in the timing band (20 weeks) has me calling this low a Gold ICL.
Of course all dominant 20 week cycle lows can never be confirmed in just 2 trading days. It takes a range of confirming events (please see the 3 confirmation points described within the above chart) over a multiple week span to provide enough evidence to call a new IC with confidence.
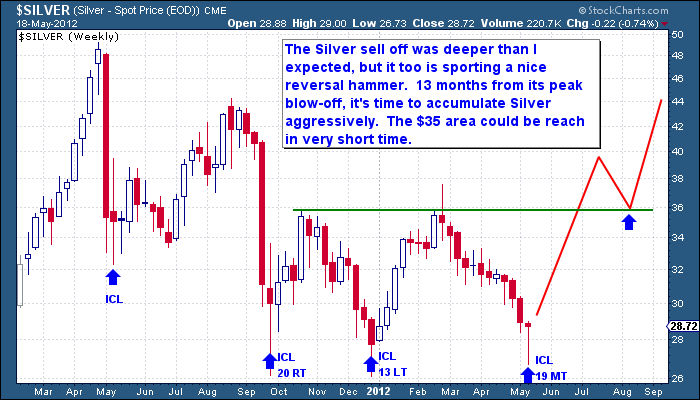
Along with my previously reported views on silver, I remain convinced that Silver should be accumulated aggressively here. It dropped a little harder than I originally expected, but it too appears to have found a significant low from which it should begin to build its base for the move back to the $50 high’s.
I have heard from many gold market followers this past week that began to question this great bull market and I find this deep seated fear a fantastic contrarian indicator. We know that general gold sentiment is at lows, but the sentiment amongst the normally bullish gold market followers is at lows last seen at the 2008 gold miner’s crash.
So let me be clear on my thoughts. I have never doubted this gold bull market, these massive secular bull markets just never end on a whimper, they end in a monstrous bang. But what all great bull markets accomplish with remarkable precision is the ability to fool and throw off even the most loyal of followers. This bull market has shown us 11 straight winning years during some extremely challenging world events, and yet here it stands some 8 fold higher in price, unloved and written off as dead. Here it stands at $1,590, not too from all-time highs, the same price as last May and Dec, yet nobody wants to own it. Seriously, how could it be dead when the general public hardly ever owned it (still don’t) and while the Fed (and all world CB’s) have inflated their balance sheets and money supply. The world is on the brink of another world-wide recession, and the Sovereign debt obligations are not mathematically feasible without massive amounts of new fiat issuance. Additional new massive amounts of central bank liquidity (world scale) are going to hit the markets over the next 24 months and it's going to send gold into the stratosphere. Learn from history’s great bull markets, profit from them, and above all protect your family’s assets.
Trading Strategy – Gold/Silver
New positions were entered into on Thursday once it was clear that the swing was in place. I purposely waited for a 2nd more powerful move above the swing line to give me more confidence that the swing line would hold. Obviously it’s way too early to judge the future performance of these trades, but I hope the way these positions were traded (leading into the Cycle low and out of it) in relationship to the cycles help you better understand and appreciate the key benefits of cycles trading. The benefit of being in cash at major cycle lows is that it allows you to enter aggressively with tight stops, and to quickly develop positions into strong hand status.
Generally the previous cycle low is used as the mark to place trading stops at, however as this is an expected ICL, there is no way a new cycle after a two day $70 burst has any business going back and testing the ICL level. You may see that behavior out of Daily Cycles, but deep ICL’s are normally “shut the gates” type events, they don’t look back once they get going. A $70 drop here to test the cycle low point would most certainly be a move that would be destined to break sharply below $1,500. On this basis, this has allowed me to tweak the stops levels where I could raise them to more comfortable risk levels. The new stop levels for our aggressive positions are showing an overall portfolio risk of just 2.72%. If we see further follow through next week, I hope to move stop levels up beyond breakeven and thus remove all portfolio risk. (Position stops along with specific position, and overall portfolio risk levels are displayed on the Portfolio Page of the site). Getting in on the ground up of an ICL can be very rewarding, I advise you to find positions quickly if you have not already. I like this trade because as I believe the odds of an ICL being behind us are some 75%-85% (based on evidence presented) we’re risking just 2.72% of our portfolio to play a cycle that generally returns some 15%-25%.
As outlined within the mid-week report before these positioned were opened, I will warn you that this will not be your typical C-Wave move where you buy the first big ICL reversal and then just sit back. This will be a difficult cycle as the first couple of Investor Cycles out of a significant collapse are generally very choppy. We’re also staring at an equity market that as likely topped and a Dollar that will likely soar as this crisis intensifies. Although I’m calling a gold ICL here, that does not necessarily equates to massive gains right away. The Investor Cycles are still technically in decline as the dominant Cycle trend remains down until gold can break above $1,793. This is the high of the last IC and for gold to be considered back in up-trend, this IC needs to break above it at some point or we risk another significant leg lower in the next couple of months. For now though we have time and potentially a richly rewarding cycle directly ahead. But as I often remind you, there are no sure things in investing, we strive to be right much more often than wrong, to take advantage when we’re right, but prepared to exit when we’re wrong. Significantly limiting your downside risk, while capitalizing on great cycle setups, will be very rewarding of time.
Equities (S&P500) – Cycle Counts – Outlook Change
|
Cycle |
Count |
Observation |
Outlook |
|
Daily |
Day 52 |
Range 36-42 Days |
Past Due |
|
Investor |
Week 33 |
Range 18-22 Weeks – 4th Daily Cycle (Failed) |
Past Due |
|
4Yr |
Month 36 |
Range 44-52 Months- 8th Investor Cycle. |
Bearish |
|
Secular |
Bear |
Equities are in a secular bear market |
Bearish |
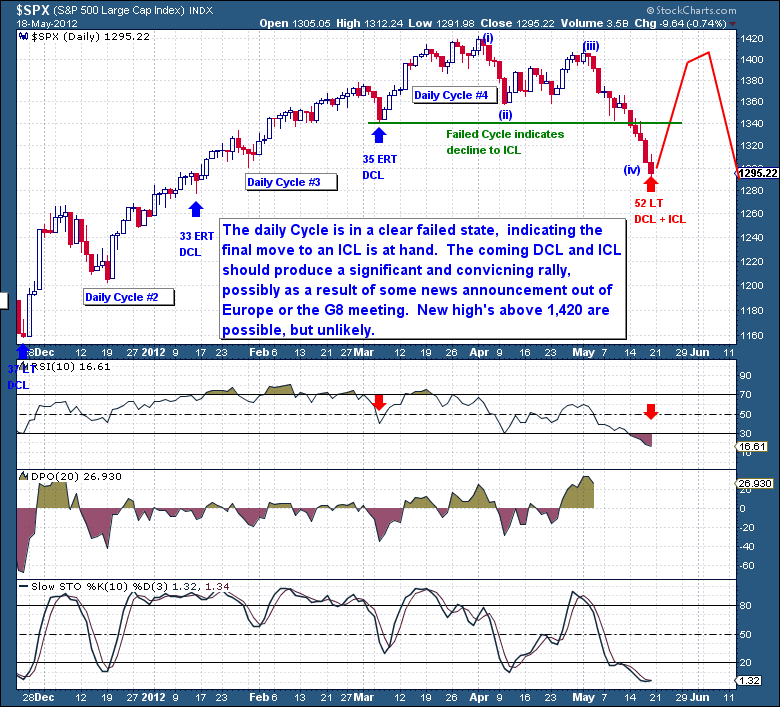
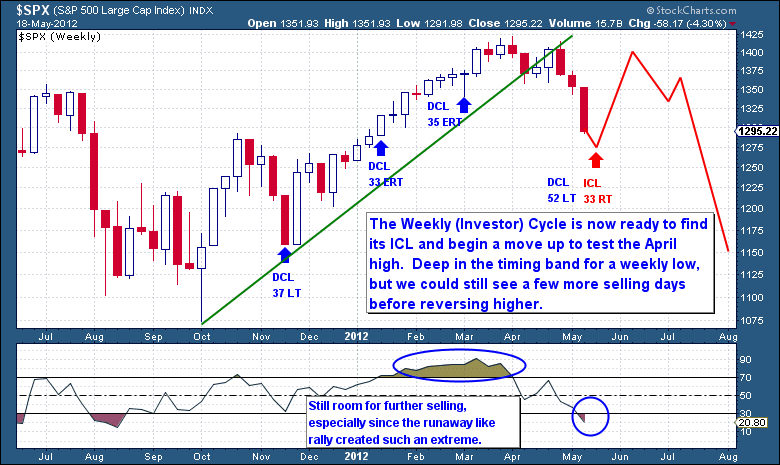
Equities have been exhibiting significant topping characteristics for many weeks now and are caught in the very depths of a final Investor Cycle Low collapse. But just like the flight from the Euro, this move has been a move from risk assets in general, out of equities and commodities; capital has been fleeing as the mounting signs of recession become clearer.
But nothing ever goes straight down and I don’t expect this impressive 3 year cyclical bull market to simply roll over and die with the first significant selling event. Major tops are a process and they often do a fine job sucking in as many unsuspecting investors before beginning their sustained bear market drop.
On the weekly chart, the drop is more pronounced, while the arching shape of the dominant cycle can be clearly seen. With a major Investor Cycle low now overdue, we could see just a few more panic selling days before this market bursts higher out of its ICL. The coming move could be powerful and likely to be convincing enough to draw in the unsuspecting crowd to what will be labeled as oversold bargains. Below the surface I suspect fund managers will be using this strength to significantly lighten their exposure. As we’re about to enter into a new IC, I cannot rule out marginal new cyclical bull market highs in June. Personally, my expectation is for a failed retest of the April highs before rolling over. Whatever the outcome, the new Investor Cycle should top out within the first 4-6 weeks which will bring with it a summer of sheer panic and collapse.
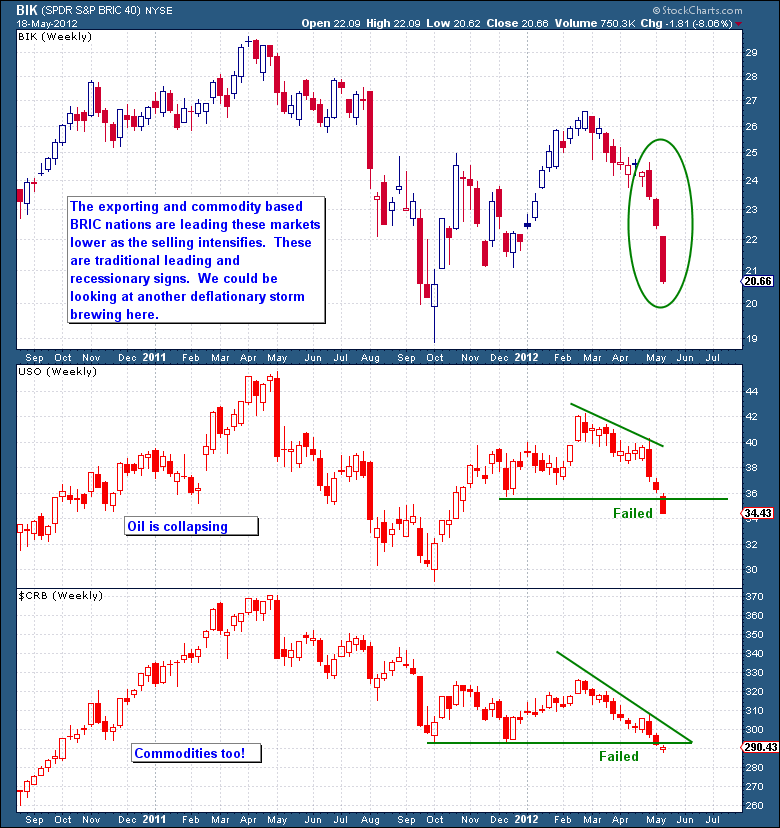
None of this should be a surprise to members as we know the dominant 4 year cycle is well overdue for a top. The 4 year cycle has been an extremely predictable and consistent cycle dating back 100 years. The 4 year cycle timing, along with the flattening of the long end of the yield curve is supporting the reports of rapidly slowing worldwide economic data. This confirmation can also be found in the BRIC nations, the export and commodity sensitive economies of the BRIC nations are declining and leading the world markets lower. As oil and commodities respond to this slowdown, a fresh new wave of deflationary pressure is beginning to simmer.
The signs and evidence of a coming world-wide recession and market collapse are everywhere. As very few policy options remain at the government level, it will again be left to the central banks to keep the Ponzi system liquid. Although I expect the markets to get much worse before the central banks act in response, it’s this massive fusion of new liquidity that will unleash the gold bull into its 3rd Spectacular blow-off phase.
Trading Strategy – Equities (S&P500)
If the market could rally back towards or over the 1,400 mark, then I will be looking to short equities at the top of the coming Daily Cycle. The downside potential afforded by the tail end of a 4 year cycle is just far too rewarding to pass up.
Please note. This is a standard weekly report which members receive twice per week as part of their membership. For more information regarding The Financial Tap and to see how The Financial Tap has shown (in real time) a 40%, 12 month return with limited risk and no leverage, consider a no obligation 15 day trial by clicking onto the Subscribe or Free Trial Links at the top of this page.
Glossary – Terminology
Cycles
Much of nature and mankind's actions move in definable, predictable cycles. Whether that be the seasons, the planets, war's or our cycle of sleep. In the marketplace, cycles of varying lengths influence the price of securities, they track the ebb and flow of human emotion and its effect on price. The studies of cycles are a powerful analytical trading tool that can give investors an edge, allowing them to get a jump start on trends and trend reversals.
One complete cycle is measured from two low points, the start and the end of the cycle. A number of daily cycles make up one Investor Cycle and a number of Investor Cycles make up one longer term cycle, like the often quoted 4yr year Equities cycle. Picture the cycles being intertwined with the long duration cycles greatly influencing the outcome of the next shorter duration cycle. Understanding the likely movement of a longer term cycle provides us with the framework to better predict the short duration cycle we trade within.
Daily Cycle (DC)
The shortest cycle I track (although shorter cycles exist) which are measured in trading days. A typical Gold and Dollar cycle will run for 16-22 days while an equities cycle will run for 36-42 days.
Daily Cycle Low (DCL)
The DCL is the low point of the cycle which marks the end of one daily cycle and the beginning of the next cycle. Understanding when the low is expected is critical to successful cycle trading.
Investor Cycle (IC)
The Investor Cycle is measured in weeks and I consider it to be the most important cycle. The movements and flows of the Investor Cycle are much more consistent and provide a long enough time frame to allow "investors" to take position without having to manage it on a daily basis or have to stress about the short term daily whipsawing volatility. It affords us the opportunity to obtain excellent returns. The Gold, Dollar and Equities Investor Cycles average from 16-22 weeks in duration.
Investor Cycle Low (ICL)
The ICL is the low point of the cycle which marks the end of one Investor Cycle and the beginning of the next cycle. Understanding when the low is expected is critical to successful cycle trading.
Left & Right Translation – (LT or RT)
Any given cycle is measured from the two lowest points, the start and end of the cycle. The highest price point of the cycle is the Cycle Top. Using these 3 price points, we're able to draw a picture of the cycle from low to top to low, a bell curve of sorts. So where the top of the cycle occurs determines if the cycle is Left Translated or Right Translated.
For example, if a Daily Cycle runs for 22 days, from low to low, then the middle of the cycle is day 11 (22 divide 2). If the highest point of the cycle occurs before day 11, then that cycle is a Left Translated Cycle (Top is left of middle). If the highest point occurs after day 11, it is Right Translated (Top is right of middle).
Why is this important? The translation tells us if the cycle spent more time rising or falling. As the cycle moves to the top, price is generally rising. As the cycle moves towards its low, price is generally falling. So to expect a Left Translated cycles is to expect a cycle that rises less than it falls in price. Opposite is true in Right Translated cycles, we expect price to be rising more often than it is falling. With an expected Translation in mind, we're able to better predict the starting and ending price performance of any given cycle.
