Still too many Bond Bears
This content is for members only


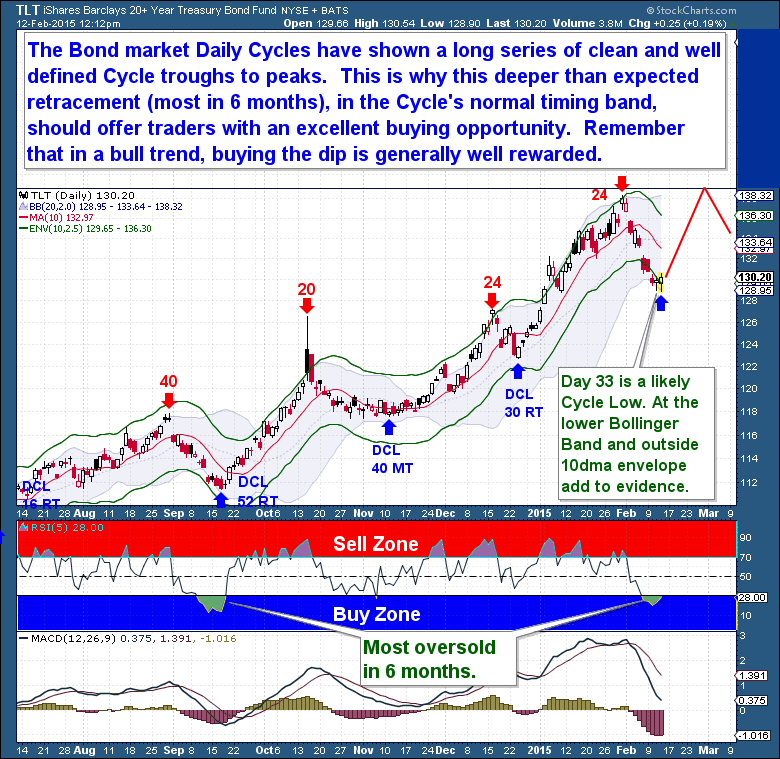
Up until last Friday, the decline shown in the bond market was anticipated because the next logical Cycle Low was due. The ebb & flow nature of the bond Cycles are very visible, clear, and well defined on the chart below. And in a bull market trend, this type of pattern makes it relatively easy for us to predict both the top and low of each Cycle.
But the bond market sell-off has intensified this week, to the point where the expected Daily Cycle Low should have been comfortably behind us by now. The extent of this sell-off is approaching levels normally reserved and experienced during the deeper Investor Cycle Low, and each of those past Investor Cycle Low’s have led to some pretty substantial gains.
I doubt that’s what is occurring here, I still favor a standard Daily Cycle Low here that is likely to produce at least a powerful counter-trend rally. I say counter trend because the worst case scenario is that this coming Daily Cycle rally forms a double top before turning lower towards a true Investor Cycle Low. Regardless, a rally is forthcoming and we know in any bull market uptrend, the dips should be bought.
You’re just 1 minute away from profitable trades! please visit: http://thefinancialtap.com
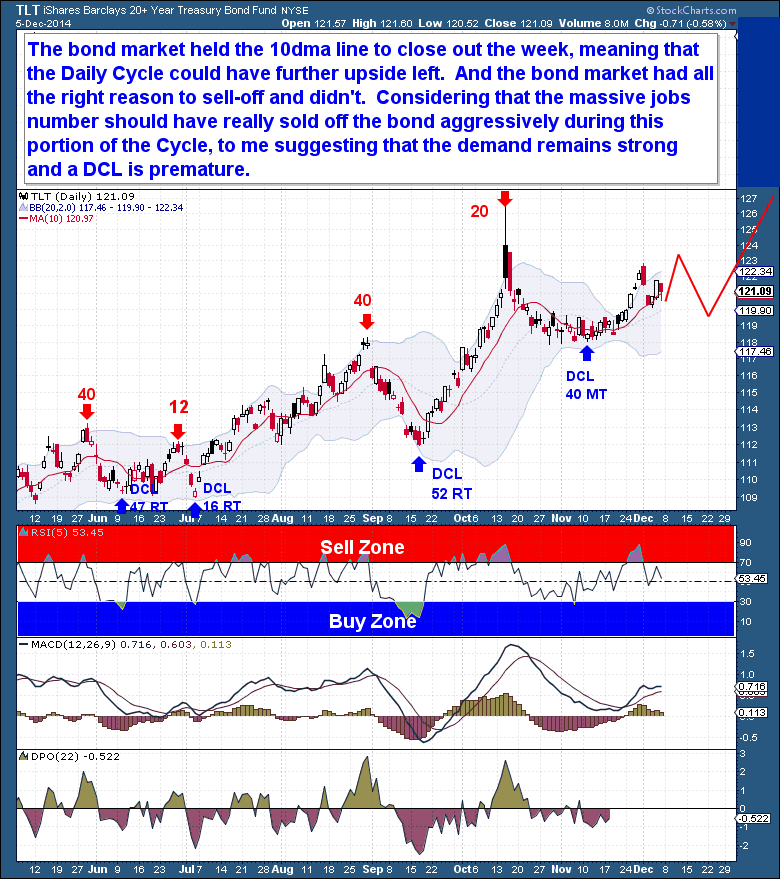
A solid U.S. employment report on Friday sparked a sell-off in the U.S. government bond market. And with the positive report, the FED is now under pressure to raise rates sooner than the market had been expecting. Considering that the bond market is already deep enough in the current Daily Cycle, it was surprising to see price hold above the 10dma to close out the week.
In reality, even more than the Gold market, the bond market had every reason to sell off aggressively on Friday. The Cycle timing was supportive of a decline, and the massive 2014 rally and overbought nature of the bond market made it ripe for a “realization” sell-off.
Considering the massive jobs number, the fact that bonds didn’t sell off shows just how much investors believe that the equity markets are carrying outlandish risk. This is a cyclical bull market in bonds because there is an underlying rotation into bonds at the same time speculative (high risk) capital continues to flow into equities.
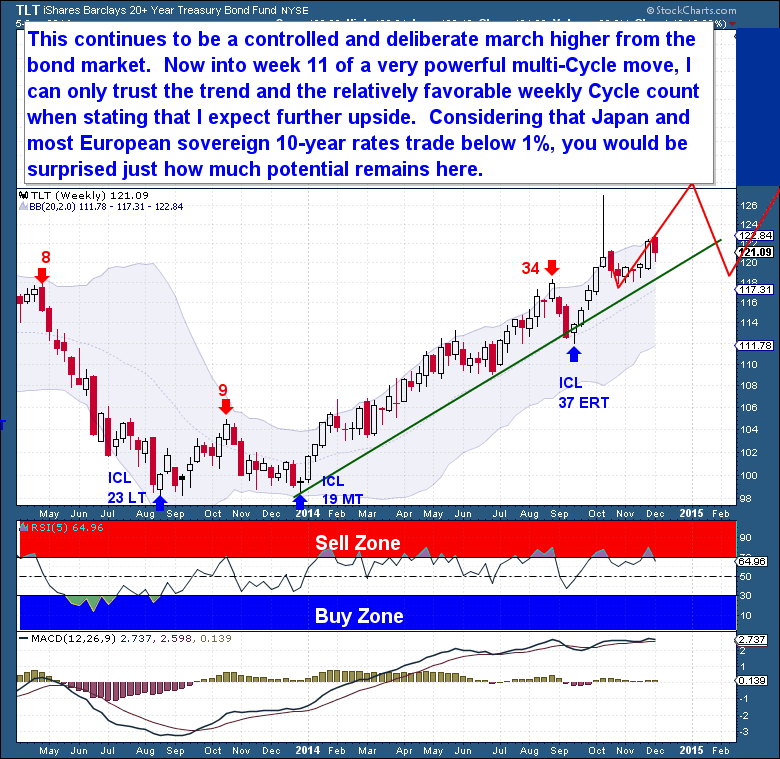
If the equity markets were correct, and the economy was truly doing well, the bond market would be making new lows instead of new highs! Bonds continue to be gripped in a controlled, deliberate march higher, reflecting a cyclical bull market.
As the bond market enters week 11 (of a standard 22-26 Week Cycle) within a powerful, multi-Cycle move, I can only trust the trend and the relatively favorable weekly Cycle count when declaring that I expect further upside. And considering that 10-year Japanese and German bonds trade well below 1%, while (most) European sovereign bonds trade below 2%, the US 10 year bonds yielding 2.3% shows us there is a surprising amount of upside potential remaining in the bond market.