What are Market Cycles
Cycles are everywhere and our lives are intertwined within them. There are cycles in the seasons, in the weather, in interplanetary movements, in human aging, and even human moods. Cycles also extend into the affairs of humans, where economic and business cycles describe periodic movements in world economies and financial markets. The prices of financial assets move in repeating rhythms as our emotions related to these assets ebb and flow.
At its simplest, a Cycle is a sequence of events that repeats. Each event in the sequence is similar to a past event. When strung together in the sequence, these sequences are similar to prior sequences….creating a repetitious pattern (cycle) that characterizes the flows of an asset over time. The longer the history of events that form the Cycles, the more definable the Cycle becomes.
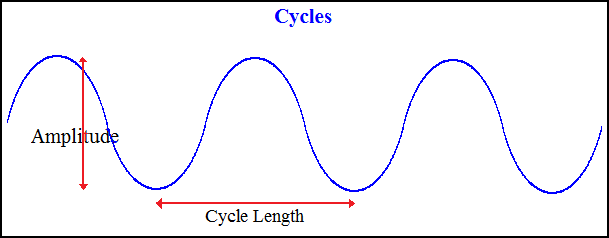
One complete Cycle is measured from two low points which mark the start and the end of the Cycle. But a Cycle is not to be viewed as a static series of overlapping events. It’s best to visualize a Cycle like a series of waves – each wave trough signifies the completion of a cycle, which is followed by a move up to a peak and then down into another trough, which signifies another cycle. Notice how the each cycle does not overlap, but is rather a natural progression further along a path.
Though cycles are linear and based upon repeating sequences of events, each cycle is unique. Each Cycle is typically different from the immediately previous Cycle, and most often from all Cycles before it.
Cycles within Financial Markets
Assets within financial markets move in Cycles; this is a well-documented, readily-observable phenomenon.
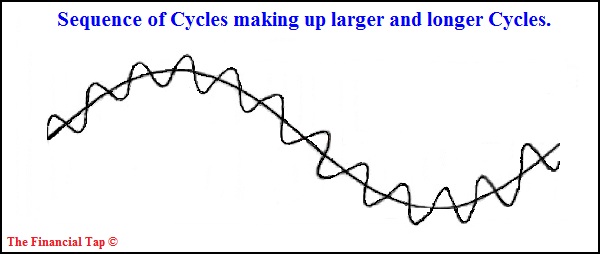
We also know that an asset will move in multiple Cycles over varying time-frames. For example, evidence shows that over a shorter period of time, measured in days, an asset will complete one full Cycle (Daily Cycle). But we also see the same asset forming a longer Cycle over a number of weeks (Weekly or Investor Cycle). This process is also repeated with monthly and even yearly cycles.
All of these time-based Cycles are interrelated. Within any ‘super’ Cycle (one that spans many years), we find a number of periodic yearly Cycles or roughly similar duration. Within these cycles, there is a subset of monthly cycles, and within these, weekly cycles, and so on. The process is repeated all the way down to an hourly level, creating a long and complex web of intertwined Cycles.
Cycles versus Technical/Trading Systems
Cycles are not a technical trading system; rather, they are simply a representation of the movements of a market or asset. Because all markets move in Cycles, they are never right or wrong, even if a given cycle is shorter or longer than expected. This is a difficult concept for many to understand, but it’s very important. Cycles are not a predictive system; they are simply a reflection of the market or an asset, even though they occur with roughly similar durations.
As an example, if an asset drops suddenly or unexpectedly when 98% of all prior Cycles did not drop at a similar point, this is not a failure of Cycle analysis. The market is acting in an unexpected way, but the cycle is still valid. The expectation that 98% of observed cases must actually occur 100% of the time is reasonable, but a failure in the 2% of cases should not cause cycles to be questioned. When we demand that a market Cycle perform a certain way, we are ignoring the natural variability that is the hallmark of the markets and Cycles.
Cycle Terminology and Frequently Used Terms
Amplitude
Amplitude is the range of the Cycle from low to high, measured in whatever units ‘denominate’ that Cycle. For example, in the financial world, a Cycle’s amplitude is typically measured in a currency. The amplitude is the range in price from low to high within a Cycle.
Cycle Length
Cycle Length refers to the timing of the peaks or troughs within a Cycle. In the financial world, the Cycle length is measured in calendar terms. For example, one Daily Cycle might average 22 trading days between lows. A longer duration Cycle is measured in weeks, while the secular Cycles are measure in months and even years.
Daily Cycle (DC)
The shortest Cycle which we track at The Financial Tap (although shorter Cycles exist) is the Daily Cycle, which is measured in trading days. All Cycles are measured from the low point of the Cycle to the next low point. Each asset tracked has unique Cycle characteristics which we have tracked over time. A typical Dollar Cycle will run for 16-22 days, a Gold Cycle will run 24-28 days, while an Equities Cycle will run for 36-42 days.
The duration of the Cycles vary depending upon which Daily Cycle within the larger (dominant) Investor Cycle we are in. For example the 1st Daily Cycle of a new Investor Cycle is typically a longer Cycle than say the 4th or last Daily Cycle of an Investor Cycle.
Daily Cycle Low (DCL)
The DCL is the low point of the Cycle which marks the end of one Daily Cycle and the beginning of the next Cycle. Understanding when the low is expected is critical to successful Cycle trading.
Investor Cycle (IC)
The Investor Cycle is measured in weeks and is the most important Cycle for investment purposes. The movements and flows of the Investor Cycle are much more consistent than those of shorter cycles, and Investor Cycles are long enough to allow investors to take a position without having to manage it on a daily basis. The Gold, Dollar and Equities Investor Cycles average from 16-22 weeks in duration, although they can easily stretch to 22-26 weeks.
Investor Cycle Low (ICL)
The ICL is the low point of the Cycle which marks the end of one Investor Cycle and the beginning of the next Cycle. Understanding when the low is expected is critical to successful Cycle trading.
Half Cycle Lows (HCL)
The Half Cycle Low is natural mid-Cycle Low point that is found within most Cycles. It’s typically a lower point within a Cycle that occurs around the middle of the expected length of the Cycle.
Timing Bands
Every Cycle has a timing band for when we expect significant pivots to occur within the cycle. Whether a Cycle Low or Cycle Top, we expect Cycles to form important pivots within expected time frames. These time frames are not arbitrary numbers; they are derived from the history of an asset’s past Cycle behavior. The more we know about an asset’s past Cycle characteristics, the better our odds are of predicting the future price movements.
It’s important to understand that these timing bands encompass roughly 70% of cases. When we say that a given market forms a Cycle Low between 18-24 weeks, we are saying that a Cycle Low occurs within that timing band roughly 70% of the time. 30% of the time it will fall outside of that band and it could be shorter or longer.
Cycle Failure
A Cycle is considered to have failed when its price falls below the price at the low point that began the Cycle. A Cycle Failure is an important development because it typically signals (in about 80% of cases) that the more dominant Cycle is in decline.
For example, if a Daily Cycle fails it means that the ending point of the Cycle will be lower than its starting point. Failing Cycles are a normal process when an asset is in decline. In bear markets we see many more Left Translated Cycles and Failed Cycles because the asset is in decline.
Dominant Cycle
The Dominant Cycle is simply the Cycle that is of longer duration to the one currently being studied. If we’re looking at a Daily Cycle, then the Dominant Cycle is the Investor Cycle, which will exert dominant influence on the shorter Daily Cycle. Just as a large body in the cosmos greatly impacts the trajectory of smaller objects, so too does a Dominant Cycle impact shorter Cycles.
Cycles in Action
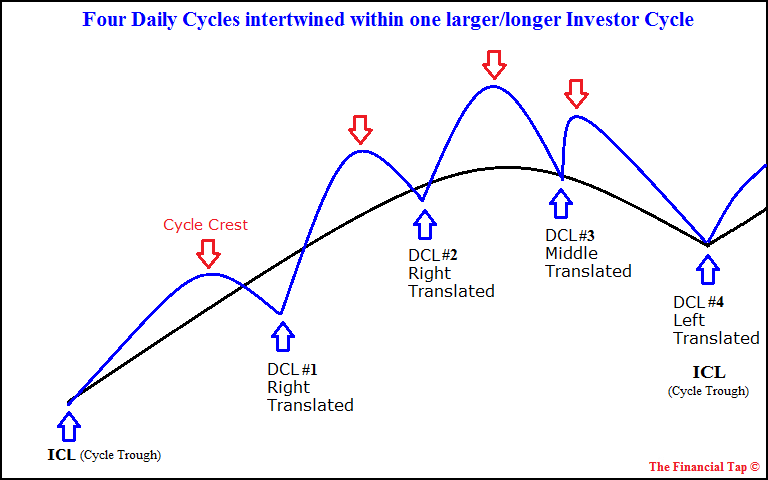
The chart below depicts the intertwined nature of Cycles. It shows the 4 Daily Cycles that make up one Investor Cycle. In reality, of course, Cycles never flow so perfectly – the amplitude (price swing) and frequency (Days or Weeks between lows) vary and it’s up to a Cycle analyst to determine where we are in a given cycle.
A number of Daily Cycles make up one Investor Cycle and a number of Investor Cycles make up one longer term Cycle, like the well-known 4yr year Equities Cycle. Picture the Cycles as intertwined, with the longer duration Cycle greatly influencing the outcome of the shorter duration Cycle.
Part of the job of a Cycle analyst is to understand the direction and trend of the more dominant Cycle. The direction of the Dominant Cycle is a primary determinant of the direction and likely outcome of the Cycle under study.
Cycle Translation
Any given Cycle is measured from the two low points that mark its beginning and end. Between the two lows, the highest price point of the Cycle is the Cycle Top. Using these 3 price points – the beginning, the end and the Cycle Top – we're able to draw a picture of the Cycle from Low to Top and back to a Low again.
The location of the top of a Cycle is extremely important in the study of Cycles. The top of a Cycle marks the point where price begins to decline towards the Cycle Low, the end of the cycle. Because a Cycle is generally a measure of time, being able to identify a Cycle Top in relation to its coming Cycle Low allows us to build an expectation of the duration and potential severity of the decline.
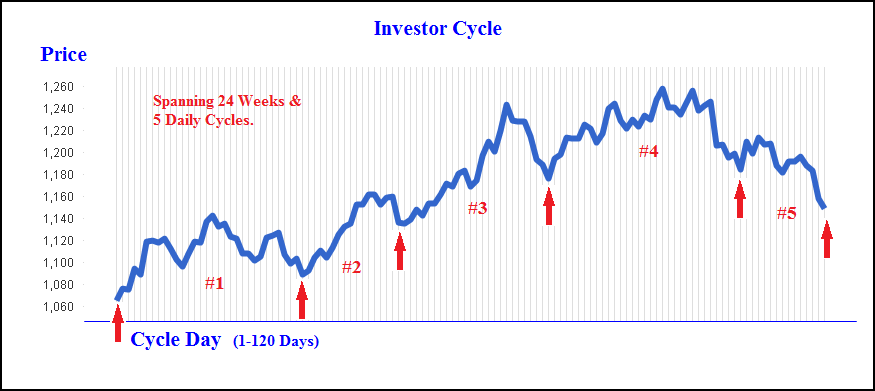
The below chart shows a complete Gold Investor Cycle from several years ago. It contains arrows that delineate the 5 Daily Cycles that comprise one Investor Cycle. Notice how the Investor Cycle is Right Translated, meaning that the top of this Cycle – in Daily Cycle #4 – is far to the right of the Cycle’s midpoint.
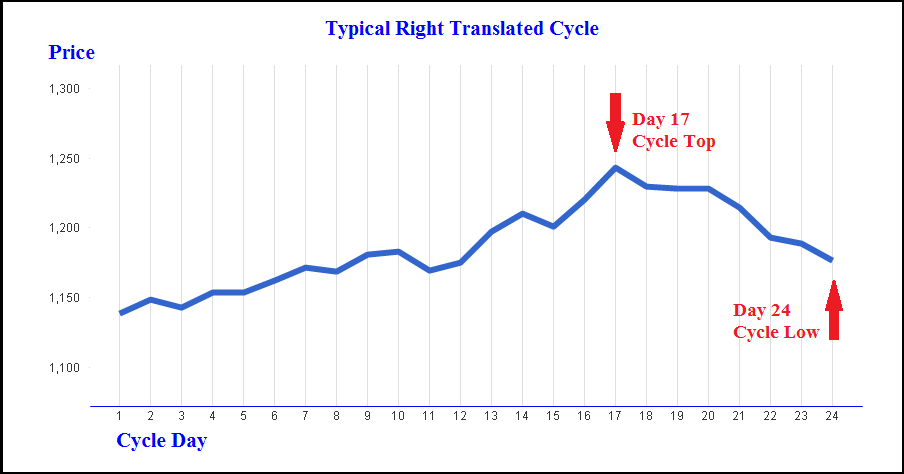
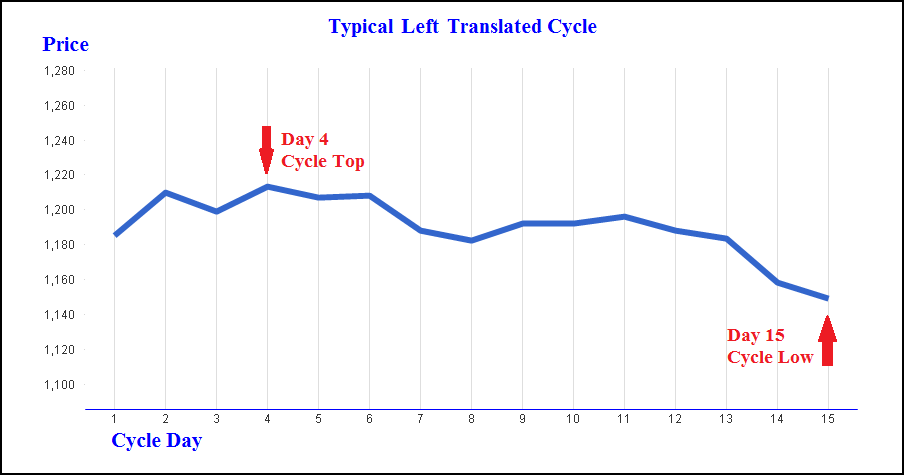
The location of the top of the Cycle versus the Cycle’s midpoint determines the Cycle’s Translation. For example, if a Daily Cycle runs for 22 days, from Low to Low, then the middle of the Cycle is day 11 (22 divided by 2). If the highest point of the Cycle occurs before day 11, then that Cycle is a Left Translated Cycle (Top is left of middle). If the highest point occurs after day 11, it is Right Translated (Top is right of middle).
Why is this important? The translation tells us whether the Cycle spent more time rising or falling. As the Cycle moves to the top, price is generally rising, and as the Cycle moves towards its low, price is generally falling. So to expect a Left Translated Cycle is to expect a Cycle that rises for a shorter time than it falls. The opposite is true in Right Translated Cycles. With these, we expect price to rise for a longer period of time than it falls.
Right Translated Cycles (RT)
The chart below is the 3rd Daily Cycle from the above Investor Cycle chart. Since the peak of this 3rd Daily Cycle occurs more than halfway through the cycle, this Cycle is Right Translated. And because it spent 17 days rising and only 7 days falling, the overall oscillation of the Cycle is higher.
If you’re looking at a Daily Cycle and expect the Dominant Investor Cycle to be rising and Right Translated, then you should expect the Daily Cycles to also be generally Right Translated.
Left Translated Cycles (LT)
The chart below shows the 5th and final Daily Cycle from the Investor Cycle chart shown two charts above. Notice how, as the Investor Cycle topped, the corresponding Daily Cycle was Left Translated so it could support the decline in the Dominant Investor Cycle.
The final Daily Cycle of the above Investor Cycle spent only 4 days rising to a top before falling for 11 days into a Daily Cycle Low. Notice that this Daily Cycle failed (it fell below the prior Daily Cycle low). Almost all ending Daily Cycles are failed Cycles. The end of this last Daily Cycle in the Investor Cycle also marked the end of the Investor Cycle.
Swing Low
The terms Swing Low and Swing High are common in Cycle study, and are related to trading Cycles rather than defining them.
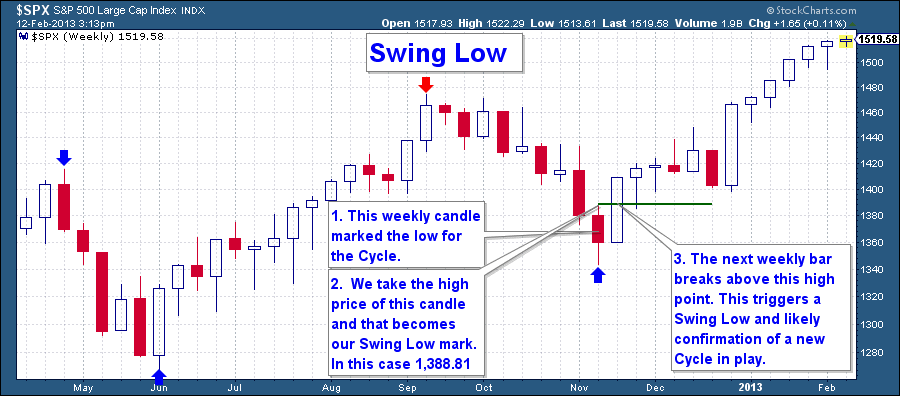
A Swing Low occurs when a Cycle appears to have made a key Cycle Low. A Swing Low can occur on any Cycle time frame. A Daily Swing Low is observed on a Daily chart, and an Investor Cycle Swing Low is observed using a Weekly chart.
A Swing Low occurs when price first rises above the high point of the candle that contains the lowest point of the Cycle. So by definition, a Daily Swing Low cannot occur on a Day when a new low has been made. However a Swing Low will be made on the next trading session during which price rises above the highest point of the candle containing the Cycle’s Low point.. As an example, the below chart shows a Weekly Swing Low:
Swing High
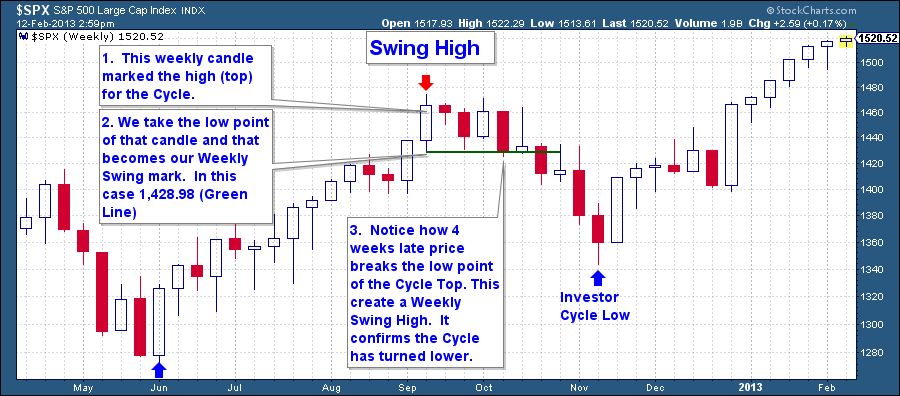
A Swing High occurs when a Cycle appears to have made a key Cycle Top, and can occur on any time frame. For example, a Daily Cycle is measured in trading days, so a Daily Swing High is observed using a Daily chart.
A Daily Swing high occurs when price falls below the lowest point of the candle that contains the highest point of the Cycle – the Cycle Top. So by definition, a Swing High cannot occur on a Day when a new high is made. However a Swing High occurs on the next session that contains a price print that is less than the low mark of the candle that marked the Cycle Top. As an example, the below chart shows a Weekly Swing High.
Cycle Clarity
Cycle Clarity is a unique Financial Tap indicator which we use to describe our confidence a particular Cycle marking. These indicator readings are published in each member report.
We assess the clarity of a Cycle as one of three levels: 1-Green, 2-Amber, or 3-Red. Since cycle interpretations are rarely clear-cut, there are generally competing options in marking Cycles. To ensure that trades are high probability, they should be taken only when there is confidence that Cycles support them.
Our Cycle Clarity levels are:
1-Green – A Green assessment means that we're almost 100% certain that the current Cycle Counts are accurate and that no other viable Cycle interpretation exists.
2-Amber – Amber means that we see conflicting Cycle counts, but we greatly favor one count over another. In any case, caution must be shown when trading using a Cycle count that is Amber.
3-Red – Red indicates conflicting and contradictory Cycle counts that provide no real edge to the investor. Trading using a Cycle in Red status should be avoided.
