Trading With Market Cycles
Trading with market Cycles can be a path towards successful market speculation. Cycles are everywhere and our lives are intertwined within them. There are cycles in the seasons, in the weather, in interplanetary movements, in human aging, and even human moods. Cycles also extend into the affairs of humans, where economic and business cycles describe periodic movements in world economies and financial markets. The prices of financial assets move in repeating rhythms as our emotions related to these assets ebb and flow.
At its simplest, a Cycle is a sequence of events that repeats. Each event in the sequence is similar to a past event. When strung together in the sequence, these sequences are similar to prior sequences…creating a repetitious pattern that characterizes the price flow of an asset over time. The longer the history of events that form the Cycles, the more definable the Cycle becomes.
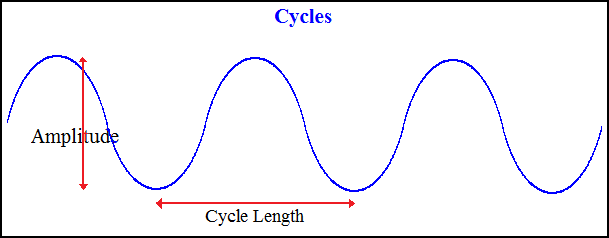
One complete Cycle is measured from two low points which mark the start and the end of the Cycle. But a Cycle is not to be viewed as a static series of overlapping events. It’s best to visualize a Cycle like a series of waves – each wave trough signifies the completion and the beginning, which is followed by a move up to a peak and then down into another trough, and the process repeats itself. Notice how each cycle does not overlap, but is rather a natural progression further along a path.
Cycles within Financial Markets
Assets within financial markets move in Cycles; this is a well-documented, readily-observable phenomenon.
We also know that an asset will move in multiple Cycles over varying time-frames. For example, evidence shows that over a shorter period of time, measured in days, an asset will complete one full Cycle (Daily). But we also see the same asset forming a longer Cycle over a number of weeks (The Weekly or Investor). This process is also repeated with monthly and yearly Cycles.
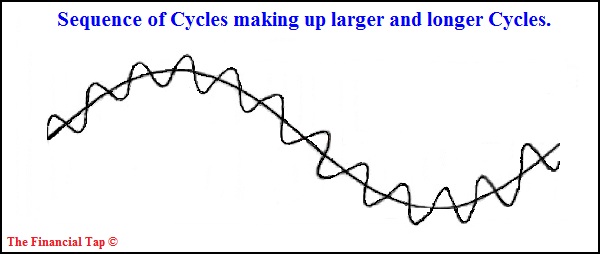
All of these time-frames are interrelated. Within any ‘super’ Cycle (one that spans many years), we find a number of periodic yearly Cycles of roughly similar duration. Within these cycles, there is a subset of monthly cycles, and within these, weekly, and so on. The process is repeated all the way down to an hourly level, creating a long and complex web of intertwined Cycles.
Cycles in Action
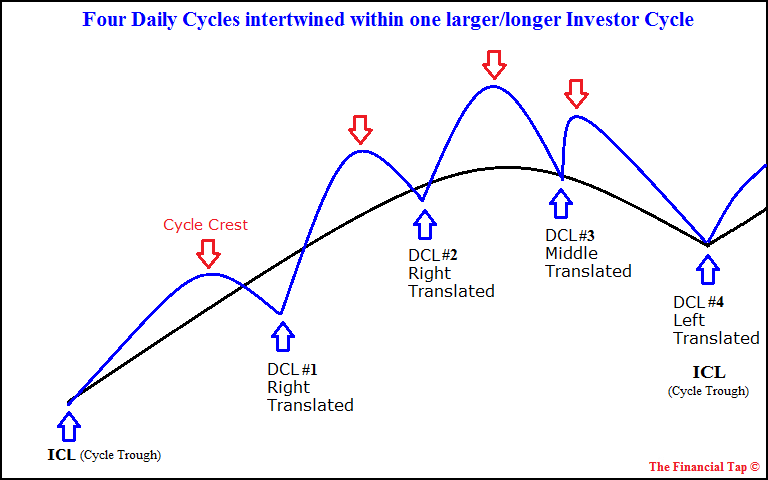
The chart below depicts the intertwined nature of Cycles. It shows the four Daily Cycles that make up one Investor Cycle. In reality, of course, they never flow so perfectly – the amplitude (price swing) and frequency (Days or Weeks between lows) vary and it’s up to an analyst to determine where we are in a given cycle.
A number of Daily Cycles make up one Investor Cycle and a number of Investor Cycles make up one longer term Cycle. Picture them as intertwined, with the longer duration Cycle greatly influencing the outcome of the shorter duration one.
Part of the job of an analyst is to understand the direction and trend of the more dominant Cycle. The direction of the Dominant Cycle is a primary determinant of the direction and likely outcome of the Cycle under study.
About the Financial Tap
The Financial Tap publishes two member reports per week, a weekly premium report and a midweek market update report. The reports cover the movements and trading opportunities of the Gold, S&P, Oil, and $USD Cycles. Along with these reports, members enjoy access to two different portfolios and trade alerts. As these portfolios trade on varying timeframes (from days, weeks, to months), there is a portfolio to suit all member preferences. If you’re interested in learning more about The Financial Tap and the services offered, for the cost of less than one of your losing, stop out trades, please visit https://thefinancialtap.com/


