
Year in Review and What Might Lie Ahead
First Ever Sale of The Financial Tap – ENDS Tuesday Midnight.
Fourteen years ago, I started The Financial Tap on a simple belief: Markets reward process over emotion, allocation over ideology, and patience over noise. 2025 was another proof point of that discipline, from a precious metals overweight to full stock exposure, members weren’t guessing, hoping, or defending narratives. The long term portfolio returned an estimated 45% during 2025, with very little drawdown or volatility.
And that’s the real value of this service:
You don’t subscribe for information — you subscribe for a framework that helps you act on information without sabotaging yourself.
A strategy layer that keeps you out of consensus traps, emotional trading loops, and the high-turnover bias cycles that dominate investor discourse today.
At midnight Tuesday Jan 6th, the opportunity to secure the original founding rate, a $100 recurring discount every single year, forever, disappears with the cycles.
If you’ve been following me or been a member before, you already know: I don’t chase attention, I don’t amplify hype, I don’t curate bias, I study trend, weight allocation, and play the long game.
Claim your 2025 Rate + $100 Off Recurring Link → https://thefinancialtap.com/checkout5-2/?rid=prj2iO&coupon=ROLLBACK
ALLOCATIONS
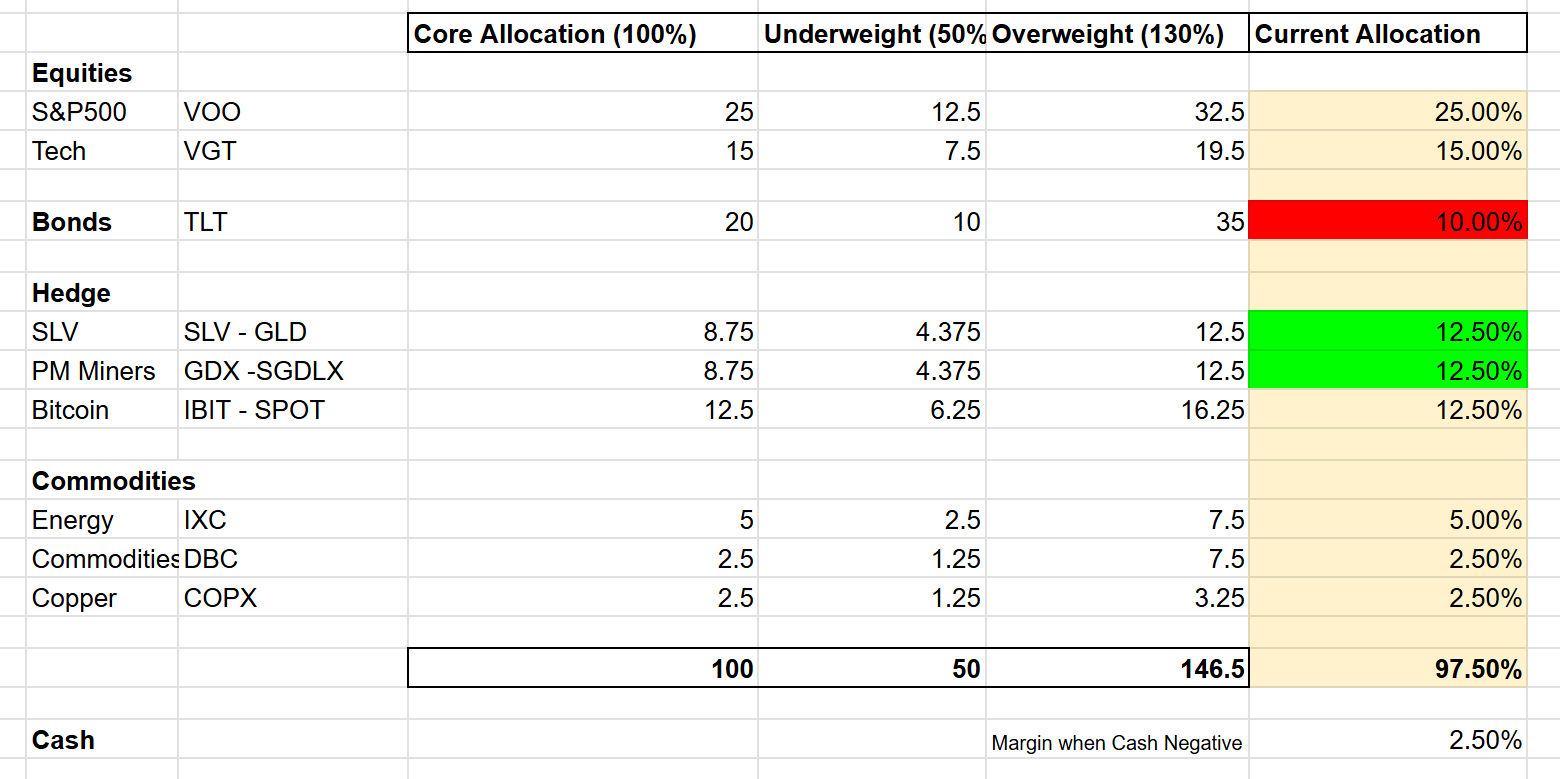
Model Portfolio Positions –
Gold/Metals – Overweight Position. Transitioned from SLV to GLD.
S&P/Equities – Core Position
Crude Oil/Energy – Core Position
Bonds- Underweight Position
Bitcoin – Core Position (Change)
VIDEO REPORT
CYCLE COUNTS
Gold Cycle
| Cycle | Count | Observation |
Cycle Trend |
Cycle Clarity |
| Daily | Day 47 | Range 24-28 Days | Late Cycle | Green |
| Investor | Week 20 | Range 22-26 Weeks | Late Cycle |
Green |
Supporting Indicators
| Sentiment Level | 74% | Excessive |
| Primary Trend (Weekly Chart) | Bull Trend |
S&P500
| Cycle | Count | Observation |
Cycle Position |
Cycle Clarity |
| Daily | Day 29 | Range 38-44 Days | Mid Cycle | Green |
| Investor | Week 7 | Range 26 Weeks | Early Cycle | Green |
Supporting Indicators
| Sentiment Level | 70% |
Bullish |
| Primary Trend (Weekly Chart) | Bull Trend |
CRUDE OIL
| Cycle | Count | Observation |
Cycle Position |
Cycle Clarity |
| Daily | Day 12 | Range 36-42 Days | Early Cycle | Green |
| Investor | Week 12 | Range 22-26 Weeks | Mid Cycle | Green |
Supporting Indicators
| Sentiment Level | 36% |
Bullish |
| Primary Trend (Weekly Chart) | Bear Trend |
$US DOLLAR
| Cycle | Count | Observation |
Cycle Position |
Cycle Clarity |
| Daily | Day 12 | Range 15-20 Days | Early Cycle | Green |
| Investor | Week 16 | Range 16-20 Weeks | Mid Cycle | Green |
Supporting Indicators
| Sentiment Level | 42% | Neutral |
| Primary Trend (Weekly Chart) | Down Trend |