Posts

Draghi to Deflate Gold

It has been a nice run of late for gold here in the latter part of this Daily Cycle. Gold has closed above the 10 day moving average for 13 straight sessions, which is the type of bullish, Right Translated Cycle behavior we’ve been longing for. And I continue to believe that gold has found a floor here on the longer time-framed Cycle, which means that this positive action is part of a larger move that will eventually show gold has moved out of a wide, 18 month basing pattern.

But all assets move in predictable, ebb & flow patterns, across multiple time-frames. And seeing as though gold is nowhere near a parabolic state, which could negate this expectation, I see the next significant move for gold as much more likely being a quick retrace of the recent gains, leading into an expected Daily Cycle Low.

Based on my Gold Cycle count, today marked Day 21 and a natural (actually slightly past due) topping point. Gold has rarely managed to become this overbought in the past 3 years and whenever it did, gold fell almost immediately back towards a Cycle Low. Today’s intra-day reversal was telling in my opinion, leaving behind an indecision candle and the type of action I would expect around a Daily Cycle Top.


1-21 Gold daily

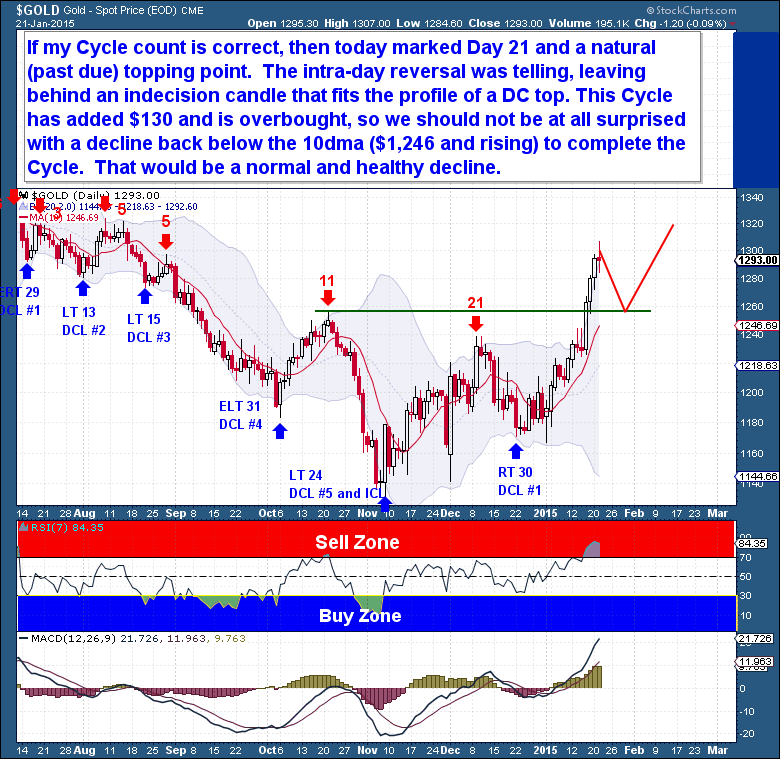
Let’s also not get too greedy or ahead of ourselves, this Cycle has after-all added $130 and is now overbought. For all these reasons, we should not be at all surprised to see a decline back below the 10dma ($1,246 and rising), over 3 to 7 sessions, to complete the Daily Cycle. Tomorrow’s ECB meeting is obviously widely anticipated and is likely to be market moving.  Therefore, it will likely also be the catalyst to send gold lower into the next Cycle Low.  It would after all actually be an expected, normal and healthy decline at this stage.

The Financial Tap publishes two member reports per week, a weekly premium report and a midweek market update report. The reports cover the movements and trading opportunities of the Gold, S&P, Oil, $USD, US Bond’s, and Natural Gas Cycles. Along with these reports, members enjoy access to two different portfolios and trade alerts. Both portfolios trade on varying time-frames (from days, weeks, to months), there is a portfolio to suit all member preferences.

You’re just 1 minute away from profitable trades! please visit: https://thefinancialtap.com

Feel free to share this post via the below social media avenues.

Midweek Market Update – Jan 21st 2015

This content is for members only

Is This Fool’s Gold?

This content is for members only

A Cycle Test for Equity Markets

An element of uncertainty has crept into the equity space as varying external risks are beginning to weigh on this market. The economic risks are certainly there, highlighted by an “average” FED beige book released yesterday. Retail sales were much worse too and they are a leading predictor of where the economy currently stands.

In my opinion, it’s only a matter of time before the world-wide deflationary pull and economic weakness begins to directly impact the US economy. Considering the FED has tapered all QE programs, in an interconnected and dependent world, the US economy has not healed enough to withstand this weakness, let alone continue to “carry the world” on its back.

The rush to bond markets world-wide continues to provide the evidence to support an economic slowdown/recession. Yesterday, the US 30 year bond hit the lowest yields ever recorded, yet market pundits wish to ignorantly remain quiet on its significance.  The flattening of the yield curve represents smart money heading for safety before the oncoming storm.

On a day to day basis, volatility continues to increase and the intra-day swings have  become much more severe and unpredictable. And the market’s character appears to be changing, in my opinion, reflecting the challenges outlined above and more resembling the action seen during past market turning points. Where the market in the past would recover the losses and rally sharply into the close, now it’s the early session rallies that are being sold into the close.


1-14 Equities Daily

The current Cycle shows just a Day 8 high, at this point it remains a classic Left Translated topping Cycle. It will remain Left Translated, meaning it will likely fail, unless somehow the S&P can recover here and rally to make All-time highs. I expect a multi-day rally from here, because we are short-term oversold, but the Cycle picture is becoming bearish by the day now.

If the Dec 1,972 low is lost it will constitute a Daily Cycle failure and print a picture perfect Investor Cycle top.  If that failure does occur, Cycles tell us (with high probability) that the S&P would have at least 8 weeks of sharply lower prices into the next Weekly Cycle Low.

The Financial Tap publishes two member reports per week, a weekly premium report and a midweek market update report. The reports cover the movements and trading opportunities of the Gold, S&P, Oil, $USD, US Bond’s, and Natural Gas Cycles. Along with these reports, members enjoy access to two different portfolios and trade alerts. Both portfolios trade on varying time-frames (from days, weeks, to months), there is a portfolio to suit all member preferences.

You’re just 1 minute away from profitable trades! please visit: https://thefinancialtap.com

Feel free to share this post via the below social media avenues.

Midweek Market Update – Jan 14th 2015

This content is for members only

Decision Time

This content is for members only

Midweek Market Update – 1/7/2015

This content is for members only

Market Update – Happy New Year

This content is for members only

Market Update – Happy Holidays

This content is for members only

Keep It Simple

What a crazy equity market this has become. The swings are just insane. I know in this business what’s “normal” is often tough to define, with the markets fully capable of a variety of wild but still-acceptable swings. Still, I have no qualms in calling the current market “irrational”. It’s a condition often found near major market lows and highs.

It was just two weeks ago that we witnessed the largest weekly selloff in over two years. That 5% decline occurred in a single week and sent the S&P tumbling below 2,000. What followed was a pair of 2% daily gains, packaged in a 3 day rally that added an amazing 100 points. This level of volatility and price fluctuation is indicative of a market controlled by speculative forces. Equities have been divorced from fundamentals for at least 3 years, leaving the market at the mercy of speculative actors: under-performing funds, speculative traders, hedge funds, and programmed bots designed to perpetuate the trend for as long as possible.

Last week, when I expected the Cycle to reverse and turn higher, I drew a projected price trend-line for the S&P that was nearly vertical. It was based on what appeared to be a blow-off move in the making. In hindsight, expecting a 180 point move, in the year’s remaining 15 days, seems unrealistic. Nevertheless, we’ve seen a 100 point rally in just 3 sessions, supporting the idea that we’re witnessing a final blow-off move.


12-20 Equities Daily

There have been a number of surprising elements to the current bull market, but I don’t believe I’ve ever before seen such a large bullish engulfing candle on the weekly chart. The last 2 weekly bars represent an almost 5% move in each direction, with this past week highlighting the dominance of the upward 3 year trend.

The 26 week (6 month) moving average has acted as solid support for the current 3 year move. Every time the S&P has tagged or moved below the 26wma during a DCL, price almost immediately bounced back to the upside. Because the S&P clearly put in a Day 43 DCL early last week, it’s in the early stages of a Daily Cycle that could potentially rally for 30 sessions. The upside potential from this point is massive. If the trend continues, the market could add another 150 points in the current DC. And if my theory of a final blow-off move is correct, the S&P could add that 150 points in a very short period of time.


12-20 Equities Weekly

The point is that all evidence points to continued upside gains. For a fundamentalist, the market at these levels is difficult to comprehend. I appreciate that people trade and invest with different objectives and on different time-frames, so if you just can’t see the market moving higher because of fundamentals, step away from trading. And in no instance should you let your bias lead you to bet against the market through a Short trade. You should either accept the market’s trend and ride with it, or acknowledge that you do not understand the market and choose to step aside. Either one is fine. But trying to bet against the market before a declining trend has been established is a very low probability trade.

The Financial Tap publishes two member reports per week, a weekly premium report and a midweek market update report. The reports cover the movements and trading opportunities of the Gold, S&P, Oil, $USD, US Bond’s, and Natural Gas Cycles. Along with these reports, members enjoy access to two different portfolios and trade alerts. Both portfolios trade on varying time-frames (from days, weeks, to months), there is a portfolio to suit all member preferences.

You’re just 1 minute away from profitable trades! please visit: https://thefinancialtap.com

Feel free to share this post via the below social media avenues.