A Faithless Rally
Another week has gone by with yet another all-time high. There has been no material change in either the long term outlook for equities or in FED policy, so one can be forgiven for being dumbfounded by the relentless march higher.
However, as I’ve said often during the past 12 months, the current move cannot be quantified. This is the tail-end of one of the strongest bull markets in history, and the forces at play are far too powerful and extreme to be rationalized with traditional metrics. The current move entered into a runaway phase long ago, and the final speculative blow-off is driving non-believers absolutely insane.
By non-believers, I refer to those who fail to understand that markets are often irrational. And that during the end of large cyclical moves, assets can be divorced from underlying fundamentals and can even behave in ways that almost seem counter to them. These extreme moves are self-fulfilling and relentless, and can cause even rational observers to raise the question of whether this time may be different. As humans, we quickly forget that all things in life, and especially in financial markets, move in distinct Cycles. How else is it possible to explain the FED missing some of the largest financial storms in history?
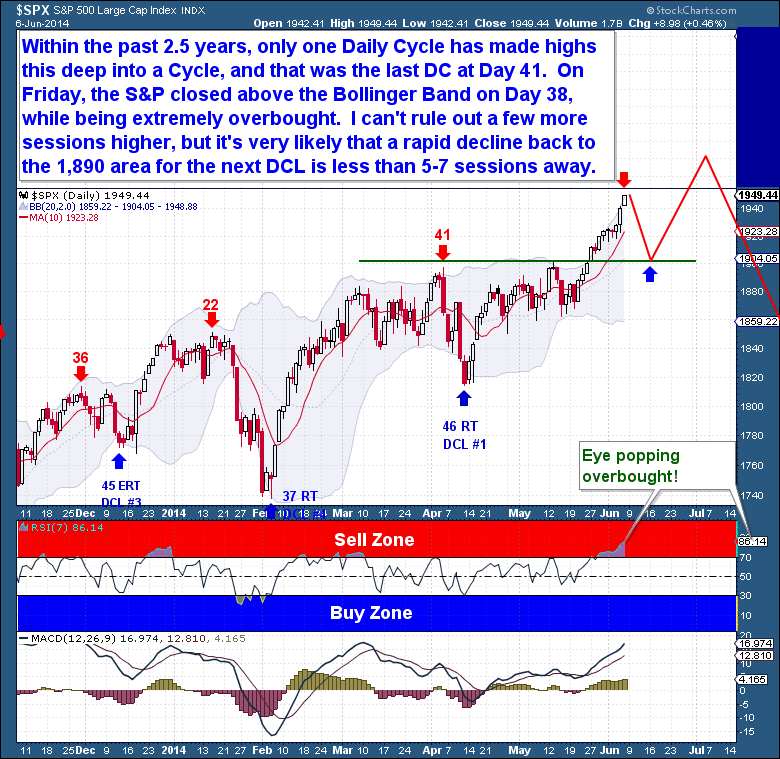
The current Daily Cycle has now matched my more optimistic forecast, set when the current DC began. And now, deep in the Daily Cycle (day 38) and very much overbought, equities should find it difficult to continue higher without some sort of short term consolidation. When I review the Daily Cycles from this past 2.5 year bull run, I can find only one other instance (41 days) where new highs were set this deep into a Cycle.
On Friday, the S&P closed above the Bollinger Band on day 38 while registering as extremely overbought. Although we can never rule out a few additional sessions higher, it is now likely that a turn down from the current top will ensue, bringing a rapid decline back to the 1,890 area. Because the current DC is already into the timing band for a DCL and the current move is speculative in nature, we should watch for heightened volatility and a sharp move lower during the next 5-7 sessions.
The DC path appears clear, but it is trickier to determine exactly what the Investor Cycle has ahead. Because the Yearly Cycle has gone parabolic and the markets are clearly irrational, the very idea of trying to pinpoint a specific outcome seems ludicrous.
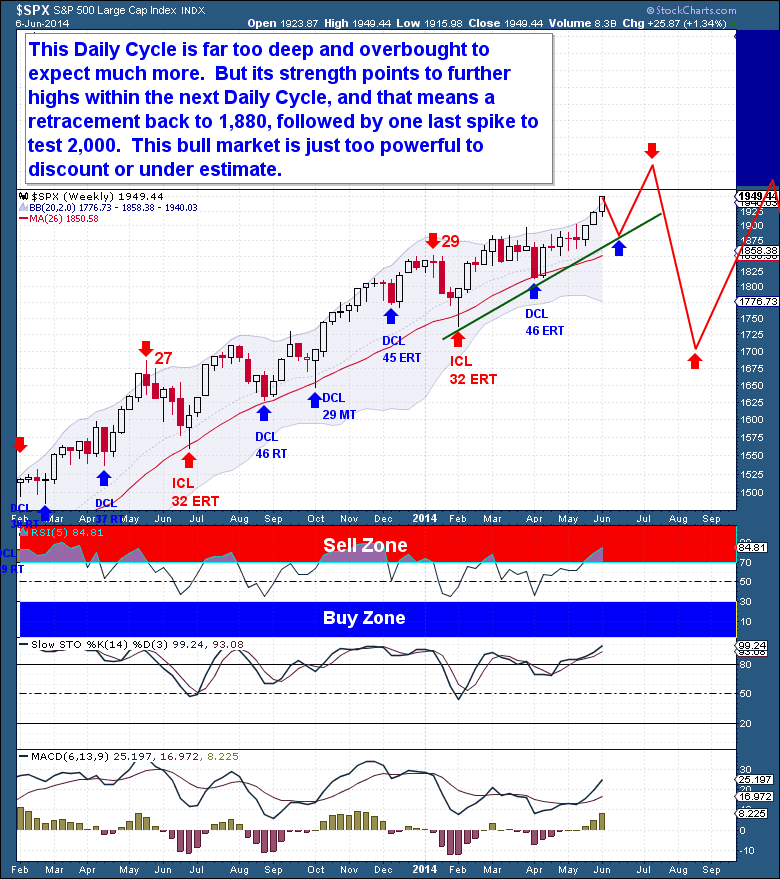
But what we do know is this: because the current DC is so deep and overbought, the next move is likely to be lower. The strength and Extreme Right Translated nature of the current DC point to a shallow DCL, with the likelihood that the next DC exceeds the current high. The next Daily Cycle (likely the top of the current Yearly Cycle) will probably make an attempt at bettering the 2,000 level. I know this sounds far-fetched, but it also sounded that way when I proposed prices over 1,800 and then 1,900 many months ago. The current bull market should not be underestimated.
The Financial Tap publishes two member reports per week, a weekly premium report and a midweek market update report. The reports cover the movements and trading opportunities of the Gold, S&P, Oil, $USD, and US Bond Cycles. Along with these reports, members enjoy access to two different portfolios and trade alerts. Both portfolios trade on varying timeframes (from days, weeks, to months), there is a portfolio to suit all member preferences.
You’re just 1 minute away from profitable trades! please visit https://thefinancialtap.com/landing/try#